The Great Exit Database: Venture Deals and Dollars in 2020


As we look back, 2020 shattered a number of records, norms, predictions, and expectations. But did the fallout from COVID impact IPOs and M&A in the venture ecosystem? Here’s what “The Great Exit Database” had to say about it.
As part of our investing team’s annual offsite, we review all U.S. venture-backed exits (M&A and IPOs greater than or equal to $100M in aggregate proceeds) that occurred in the prior year. This is a cumulative exercise that builds on all of the work done in prior years, and has come to be referred to us internally as “The Great Exit Database” or “G.E.D.” This analysis includes all venture-backed exits, not just Scale’s focus area of enterprise software.
Although we have made little public mention of this body of work to date, we thought that this year we would start to share some of our analysis as we believe that it is a strong basis of understanding for any founder or startup executive working towards a successful venture outcome. Below we walk through 2020 and conclude with some thoughts on the outlook for 2021.
The 2020 Report Card: Exits ≥ $100M
Not surprisingly, 2020 was another strong year for venture-backed exits. According to Pitchbook, there were 181 total exits equal to or above $100M (where the deal value was announced), of which 93 (or 51%) were within the technology segment (vs. healthcare or other non-tech, or non-healthcare segments). These 181 exits represented more than half a trillion ($551B) of exit value, of which technology was $416B (or 76%) of the current value**
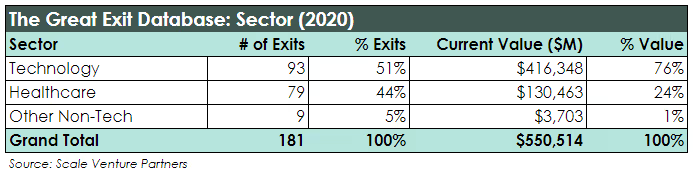
Note: Current value is defined as the enterprise value for M&A exits and the market capitalization of publicly traded companies (IPOs) as of January 11th, 2021.
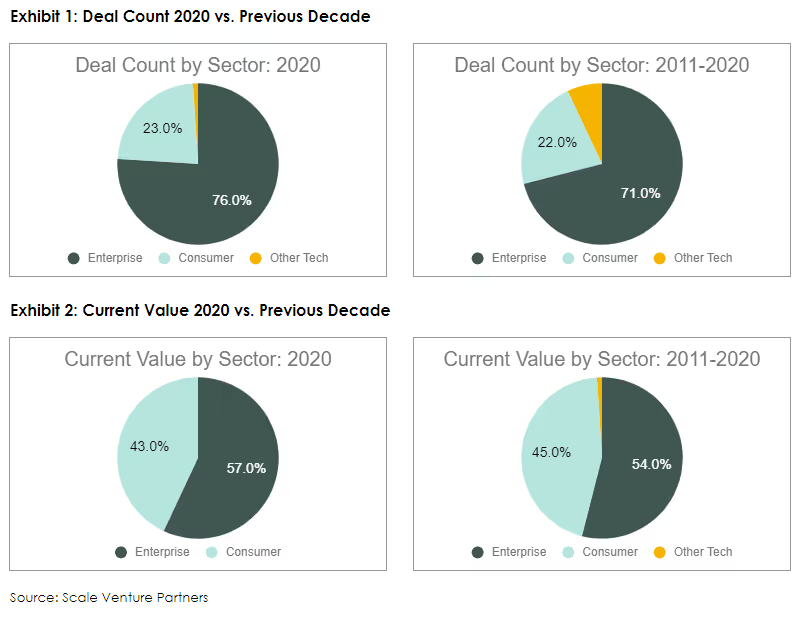
As we double click within Technology exits, we like to decouple deals that fall within the Enterprise technology ecosystem (where Scale typically invests) versus those with more of a Consumer-oriented business model or companies that don’t directly fall into either. In 2020, of the 93 exits in Technology, 71 (or 76%) fell into the Enterprise segment with the balance being more Consumer-oriented or “Other Tech” exits. Exits by value also skewed towards Enterprise businesses, but not quite as heavily. Of the $416B of exit value within Technology, $235B (or 57%) fell within Enterprise, with the balance being Consumer or Other Tech businesses.
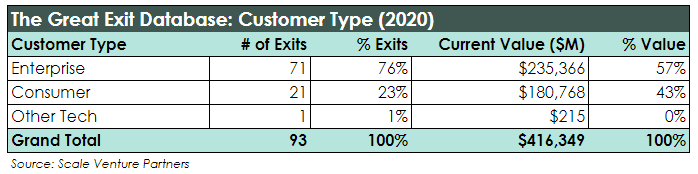
As in past years, Consumer value was driven by a very small number of exceptionally large exits. This year, both Airbnb and Doordash went public in December, and at the time of this writing, combined for $129B (or more than 71%) of all Consumer exits ≥ $100M. And while the distribution among Enterprise exits tends to be a bit less skewed, 2020 saw the public offering of Snowflake, which notched a market cap of $79.6B at the time of this writing, which alone, accounted for 34% of all Enterprise value created from exits ≥ $100M during the year.
A Ten-Year Retrospective: More of The Same (Despite What You Might Think)
One of the benefits of having compiled the G.E.D. over the last two decades is that we are able to understand how exits in the most recent year compare to longer time horizons. As we do a retrospective of U.S. venture-backed exits over the last decade, what’s interesting to note is that the breakdown of Technology exits, and more specifically, those within the Enterprise segment, are actually quite similar.
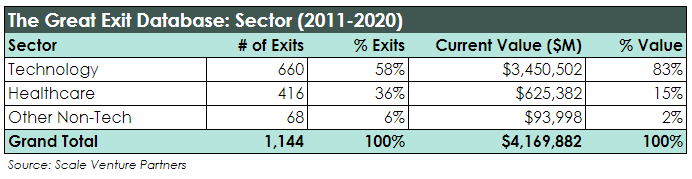
During the last decade (2011 – 2020), there were 1,144 U.S. venture-backed exits ≥ $100M, of which 660 (or 58%) were within Technology. Total deal value was $4.17T of value, of which $3.45T (or 83%) was represented by Technology businesses.
When looking more closely at the breakdown within the 660 Technology exits, 468 deals (or 71%) and $1.87T of the $3.45T (or 54%) of total deal value fell within the Enterprise segment. While 2020 was a strange year for many reasons, within the U.S.-based venture backed ecosystem, it ushered in exit activity that was actually fairly consistent with decade-long trends within the ecosystem.
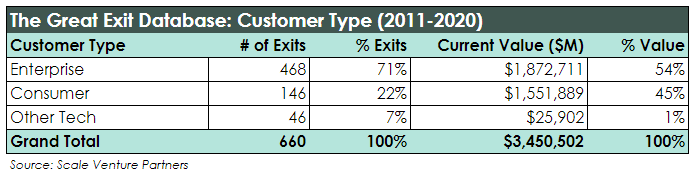
Stepping back, here are two views showing just how closely 2020 deal count and value match the trends we saw over the past 10 years.
What Will 2021 Hold for Venture Exits?
Will 2021 see significant changes in venture-backed exit activity? Software multiples in the public markets are at an all-time high. As of the time of this writing, the median EV / Revenue multiple for publicly traded SaaS companies is north of 16x, which is almost three times the long-term median SaaS multiple of 5.5x. We recently considered whether those lofty public market multiples are having an impact on private company go-to-market performance.
Assuming valuations can sustain momentum for some (if not all of) the year, it’s safe to expect that 2021 will likely be another strong year of exit activity for venture-backed companies, as founders race to cash in on historically high prices. It will be interesting to see how things unfold, and we’ll circle back a year from now to weigh in on what shakes out.
Special thanks to Rahim Noorani for leading this year’s update to The Great Exit Database. He contributed much of the analysis that underlies this report.
News from the Scale portfolio and firm