The Liquidation Survival Guide and Model: Vol 1


The Perfect Storm: Inflated Valuations + Scared Investors = Lots of Structure
We all now look back on 2021 as a euphoric time period where capital felt free and money was thrown around gleefully. Over the last year the valuation bubble burst, the chaos in the banking sector with SVB and First Republic Bank happened, and inflation and the cost of capital have risen dramatically. All these factors and many more have created a much tighter fundraising environment for startups. The same VCs that were throwing money at startups and encouraging growth at all costs are now sitting on the sidelines and telling those same startups that they are overvalued and too inefficient.
As a result of this changing market, entrepreneurs have deferred their next raise, hoping to grow into their lofty valuations or that markets will return to their previous exuberant state. But for some startups, the time for deferring the next raise has run out.
Some companies may be in a strong position for an up round or flat round if they grew into their previous lofty valuation or took a more conservative valuation in the past. But difficult choices lay ahead for those who have found themselves with a valuation that is now seen as too rich. They could take a down round or recapitalize their company to have a more reasonable valuation. But many instead opt to keep the public headline price of a flat or up round while structure is added behind the scenes.
There have been lots of articles and posts about terms, definitions, high-level scenarios, and why structure is scary. But as a firm, we have struggled to find a comprehensive resource that shows how to actually build these complicated analyses. Instead, we have passed down this tribal knowledge over time. The goal of this guide is to help entrepreneurs, venture capitalists, and any others who are entangled in the nitty gritty details of modeling these complex situations.
For entrepreneurs raising new rounds and finding themselves with multiple term sheets with diverging valuations and structure, this guide and template will be crucial to understanding how each different scenario affects the bottom-line return to each class of shareholders during an eventual exit. For instance, you may get a lower valuation or even a down round, but that could actually provide better returns for you than a higher valuation with structure.
This guide is not for the novice, and if you need a refresher or a more general overview of common terms, check out this great article by our venture peer Charles Yu. For companies currently going through an M&A process, this guide will be more practical than theoretical. This is not meant to be exhaustive but to provide you with a core level of understanding and a foundational template that can be modified to handle any scenario that comes your way.
Over the course of 5 blog posts, we’re going to discuss 4 primary Liquidation Preference Scenarios and will have an associated Excel file completed for each. In the fifth blog post, an ‘all-in-one’ automated template will be attached to assist your analyses moving forward. The 5 posts will cover:
- Non-Participating Liquidation Preference without Seniority (this post)
- Non-Participating Liquidation Preference with Seniority
- Participating Liquidation Preference without a Cap
- Participating Liquidation Preference with a Cap
- The all-in-one Liquidation Preference Template and Other Terms to Watch Out For
During the first four blog posts, we walk through each scenario, the logic behind them, and the actual calculations that need to be done. As you will see, each scenario requires a lot of specific formulas, adjustments, and some manual calculations, especially when scenarios get mixed.
In the fifth blog post, we will share a fully automated template with an instructional guide on how to use it. There are, of course, an unlimited number of scenarios and edge cases where you will need to add additional components to it or may break it. However, the hope is that this “all-in-one” template is a strong starting point for any analysis and will save others time and avoid inaccuracies.
We’ve thoroughly tested it internally, but very much encourage others to try and report bugs back to us. We’ll continue to update the model as we get feedback in an effort to help other VCs, entrepreneurs, and anybody else who is tasked with doing these analyses!
So let’s get started!
Liquidation Preference Survival Guide Vol 1: Non-Participating Liquidation Preference without Seniority
Let’s start with the most simple and foundational scenario. This is the absolute base case and cleanest term sheet. Here, we are assuming a liquidation analysis with the underlying Preferred series having Non-Participating Preferred, no Seniority, and Pari Passu (investors share proceeds pro rata to capital committed in the event that there are not enough proceeds to fully cover all investors’ preference). If you need a refresher on any of those terms, Charles Yu does a great job explaining them.
The underlying question when doing this analysis is (for each series): do they get more proceeds by taking their preference or by converting to common? We’re going to walk through how to find that answer across a broad spectrum of Exit Prices.
Many of the concepts we’ll walk through here will be essential for future, more complicated scenarios and you will see incremental layers of complexity added to these core concepts. With all of these analyses, the first step is transferring information from the legal documents and carefully noting what type of equity and terms each series is entitled to.
The Excel template for this example can be downloaded below:
Inserting the Key Inputs
All of the below inputs can be found in the company’s latest Cap Table or Term Sheet.
If you’re following along in the model, the first step is to insert the dollars invested by each shareholder for each round in the first table below. The bottom table will automatically calculate the % ownership for each shareholder in each series. For instance, if Scale Venture Partners leads the series A by investing $10M in the round out of $11M and then participates in the later rounds bringing their total investment to $24M, you will then see in the top table how much Scale owns of each of the rounds.
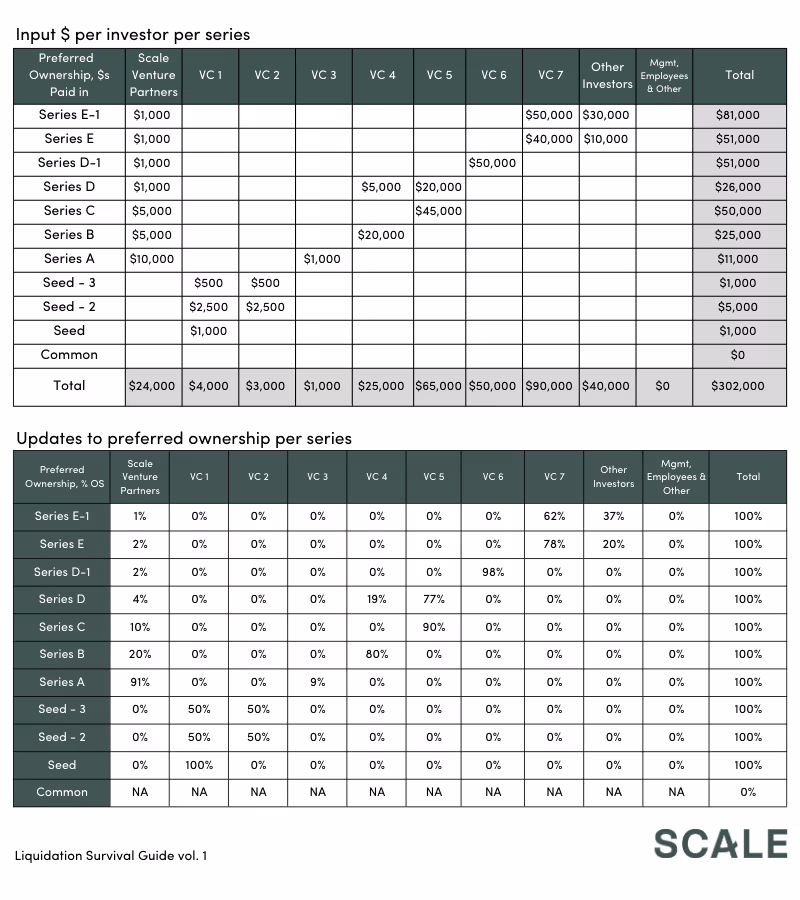
Then, insert the number of preferred shares and Issued share price (Issued PPS) for each series, noting its liquidation preference (in this scenario it’s 1x) and the preferred shares to common conversion ratio (also 1x in this scenario). It helps in these analyses to have the series ordered by lowest share price to highest share price, but not necessary.
It’s important to include the options along with common at the bottom. Note that our analysis does a small simplification here. In reality, options tend to have an associated strike price attached to them. Instead, we are treating the options as equivalent to common in this analysis. It shouldn’t have significant ramifications and if anything is a bit more conservative in terms of the returns to others.
Finding the Conversion Point
The most important point for any series is the conversion point. This is when the series decides they prefer to convert to common and leave behind any preference they had. For each series, you can think about this point on a price-per-share basis (PPS) or on a total consideration basis. To be more explicit, the series may convert at $5.00 per share which equates to some amount of consideration to equity holders, for instance, $500M. The PPS conversion point is actually fairly easy to find, the total consideration basis is much more difficult. Before calculating this point, we need to first calculate a few other data points:
- Price-per-share Conversion Point = Issued PPS X Liquidation Preference Multiple / Preferred to Common Ratio.One way to think about this is for a series to convert, they need to get more returns from common than their preference. If Scale Venture Partners buys series A shares at $1.06 per share, then for them to at least get their 1x, the PPS needs to be at $1.06.
- Liquidation preference multiple of more than 1x increases how much preference you have which raises the hurdle for you to convert. If you have a liquidation preference multiple of 2x, then you would need the share price to be double what you bought it at in order to hit your 2x of preference and for you to convert.
- The Preferred to Common Ratio has the opposite effect. When this ratio is greater than 1x it increases the amount of common you get so the hurdle to convert is lower. If you have a 2x Preferred to Common Ratio, then you would need only half the share price you initially paid in order to reach the same amount of preference and thus to convert to common.
- Common Shares Equivalent = Preferred to Common Ratio X # Preferred Shares.If the ratio is 1x, then a series gets the same number of common shares as they had preferred shares. This ratio is typically 1x, but it could be whatever is negotiated (less than or greater than 1x). We talked about in the last point how this ratio affects the conversion point.
- Preference Amount = Share price X Preferred Share count X Liquidation Preference Multiple.When the liquidation preference multiple is 1x, then it is just the amount of money invested by that series. Entrepreneurs want this multiple as low as possible, while investors would love to increase downside protection by increasing this.
- % of Total Preference = Preference per Series / Total Preference.
- Ownership of CommonIn the last point, we calculated the remaining preference. Now we are going to use a similar methodology to figure out for each series when they convert (at their PPS at Conversion Point), what % of the converted common they will own. If the series are ordered from lowest PPS at conversion from the bottom to highest PPS at the top, then the series will convert in order.Using the series A example again, if the PPS at Conversion Point is $1.06, then all series with a lower PPS at Conversion Point will have converted and be a part of the common share count. For the example above, this means that the 3 Seed rounds and the series A will have all converted at the series A PPS at convert. The series A ownership of common will be the series A’s Common Shares Equivalent divided by the Common and options + the 3 seed rounds + the series A.
- In the template, this logic is also built into a formula.
- Point at Conversion ($000) for each series = Remaining Preference + (series Preference amount / Ownership of Common).Thinking about this logically, if each series has the option to either take their preference or convert to common – it makes sense that – if there was no other preference taken – then this series would convert at the point where their preference is less than their ownership of common. To calculate this, it’s simply their preference divided by their ownership of common stock. You then have to take into account that this may not be the last series to convert and there could be remaining preference still, which is why we add the remaining preference on top. An increasing amount of preference above a series logically delays when they convert to common.
Enterprise vs. Equity Value
When a company is acquired the publicized price is typically the Enterprise Value of the business, or the total value of the business to all shareholders. The amount of money that actually goes to equity investors and management is the Equity Value of the Company.
Equity Value = Enterprise Value – Debt + Cash
Most M&A or IPO processes typically involve some amount of transaction fees. The money to the equity holders is after these fees. For ease of example, the model currently assumes no fees, no debt, and no cash. This is not realistic but allows us to work with round numbers.
Proceeds Distribution
Preference taken:
Now for the fun part — the distribution of equity proceeds. The proceeds first go towards meeting the preference of the investors. This refers back to the purpose of preference. These preferred equity holders get paid back before money goes to the common as part of a risk mitigation strategy. Remember – this is the absolute base case and cleanest term sheet. Here, we are assuming no Seniority, Non-Participating Preferred, and Pari Passu.
For each series, the test is: do they get more proceeds by taking their preference or by converting to common? Remember, this is non-participating preferred and so each series has to make a choice of converting to common or taking their preference.
The formula can be broken down into 3 components:
- Is the remaining consideration less than the total preference? If so, then the rational thing for each series to do is to take their preference. For Pari Passu, that would be their % of the preference stack X remaining consideration.
- If the above is false, and the remaining consideration is greater than the conversion point we calculated for each series above, then the rational decision is for the series to convert to common to get more consideration than their preference amount.
- Lastly, if both of the above conditions are false, where there is enough consideration for each series to get their full preference but not enough consideration for the series to convert to common, then the rational decision is to not convert to common and the series get their full preference amount.
Converted Common Shares
Above, we deciphered whether each series is taking their preference and what amount they get. Now, we need to figure out the common shares converted for each series. This logic is less convoluted:
- If the initial remaining consideration before preference is greater than the conversion point for each series, then the rational decision is for the series to convert and the number of shares is the number of common shares each series is entitled to. Remember – we calculated the Common Shares Equivalent above, make sure you reference that field and not the original preferred shares field just in case the preferred to common ratio is not 1:1.
- If the remaining consideration is less, then the share count is 0 for that series because they will not convert and will instead take their preference above.
Common Proceeds
For entrepreneurs reading this, this is where things get exciting for you and, typically, your common shares. We’ve already calculated above how many shares convert to common for each series. Now we just have to see what percent of the total common shares converted that represents.
Then, to calculate the common proceeds for each series, take the percentage of common shares that they have and multiply it by the remaining consideration to common after the preference has been taken.
Total Proceeds and Investor Distribution
Total proceeds are simply Proceeds that go to Preference + Proceeds that go to Common for each series. As a test, the sum of all the proceeds to all the series should equal the initial remaining consideration after fees have been taken out. If this is not true, something is wrong!
To find the portion of proceeds to each shareholder, take their percent ownership of each series, times the proceeds for each series, and sum that up. For example, for Scale Venture Partners – they invested in the series A and participated in all rounds after. So to calculate their returns, we take their percent ownership of each series and multiply it by the proceeds to each series and sum it all up. Instead of having a messy formula, you can do a SUMPRODUCT formula taking the investor’s percent ownership of each series and the proceeds to each series.
Lastly, if you’re an investor, you will care about what multiple you get on your investment which you can calculate on a per-series basis or overall per investor. It is simply the total proceeds divided by the capital for either the series or the investor.
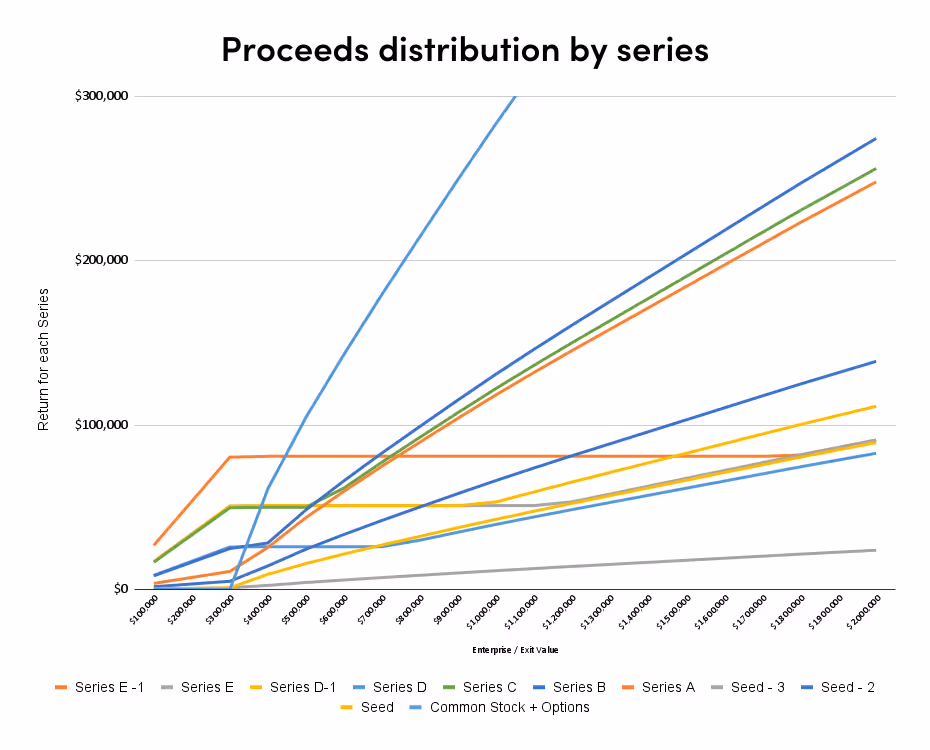
Below is a simple summary chart showing for each series their returns as the Exit Value increases.
This concludes Volume 1 of our Liquidation Survival Guide. Here’s one more link to the template. I hope you’ve found it useful. Please remember, the template is a tool, and please work with your advisors as you use it. If you have any comments, questions, or have found any issues with the template, please let me know! This is an effort to help the startup community better understand these analyses and save everyone time. We will periodically update the guide and template if any issues arise.
News from the Scale portfolio and firm