From $0 to $1M: Early Stage Burn Rates


It may come as a surprise, but Scale Studio data on hundreds of early-in-revenue startups shows that a sizable number are indeed profitable right out of the gate. Not many, and it’s not the norm, but they are out there.
We pulled data from Scale Studio showing “good, better, best” performance benchmarks for Operating Margin in the $0 to $1M revenue range:
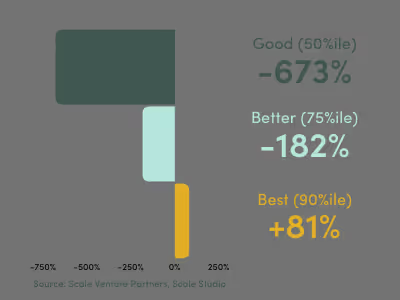
Pulling back to look at a much larger revenue range, you’ll see that early profitability is certainly an outlier. From $1M onwards, even the “Best” cohort has a negative operating margin, reflecting the need for external capital to underwrite scaling and growth.
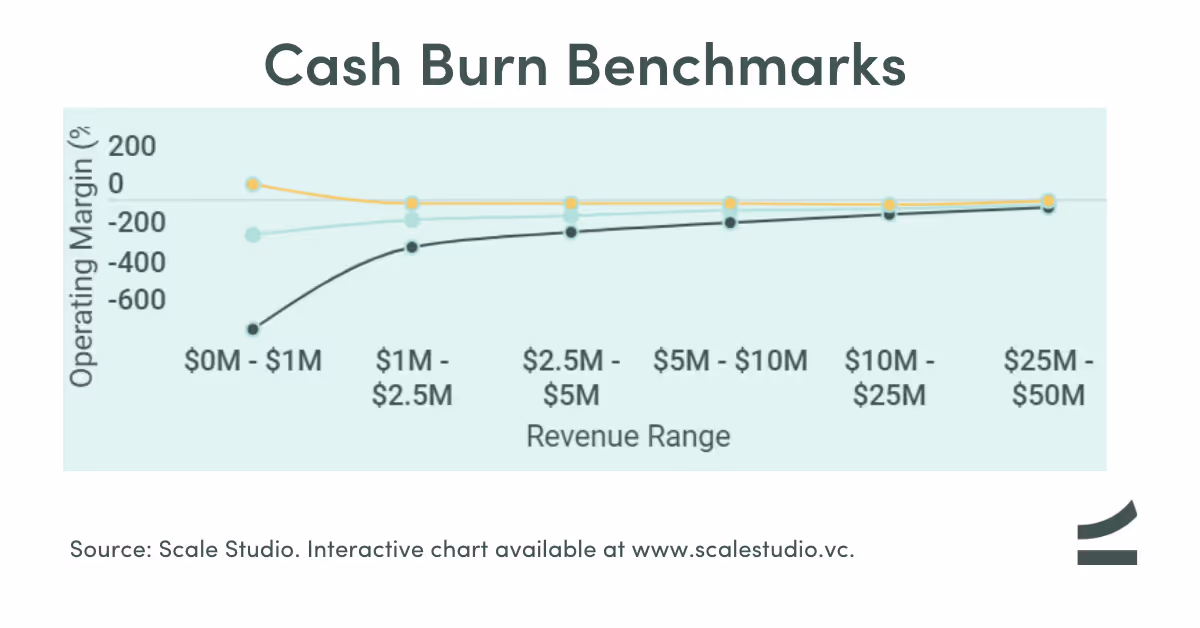
The chart above shows Operating Margin, the GAAP-based metric that looks at Operating Income (or Loss) as a percentage of total revenue. It’s formula is simply:
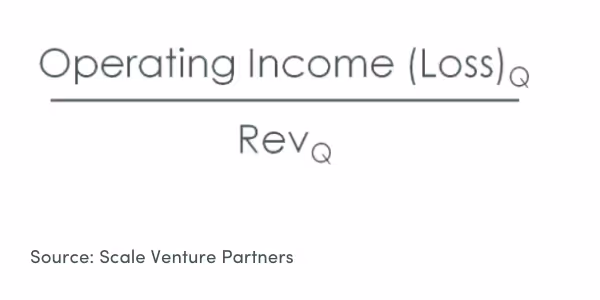
For startups, Operating Margin is a good proxy for net cash burn. It has several advantages as a single metric for measuring your runway:
- GAAP-based means it doesn’t require extra time and effort to track and calculate
- It’s possible to benchmark Operating Margin versus competitors and other startups
- It’s just one more step to calculate your runway in terms of time
Managing your burn is critical for ensuring your runway is long enough to meet your goals. One easy way to measure your runway at any given time is to simply divide your total cash balance (including unused lines of credit) by the most recent quarter’s operating loss. That gives you your runway in quarters anchored to your current rate of operating loss.
Further reading on SaaS P&L and startup burn rates:
News from the Scale portfolio and firm