A Quick Primer on the Rule of 40


There is an expansive universe of SaaS metrics out there. Which is great for tracking performance internally, as it allows a company to customize metrics to reflect its operating realities. But what if you want to compare performance between companies? That’s when the lack of standard definitions becomes a problem. Just look at how many ways customer retention is calculated.
To solve the apples-to-oranges problem, Scale developed a framework called the Four Vital Signs of SaaS, which examines four critical operating metrics – revenue growth, sales efficiency, customer retention, and burn rate – to help entrepreneurs better understand the health of their business. As vital signs quickly help medical professionals diagnose the health of a patient, these four metrics can do the same for quickly understanding the health of your SaaS business and provide a basis for comparison and benchmarking.
We wanted to apply the spirit of the Vital Signs standardization to another SaaS metric that suffers from a lack of common definition: the Rule of 40 (“RO40”). The RO40 measures the balance of a SaaS company’s growth and profitability. While this sounds simple in theory, what makes this more complicated in practice is the lack of a standard measure for profitability. In this post, we’ll take a closer look at some of these nuances.
A quick disclaimer before we get into it: as investors in early-stage enterprise software companies, Scale doesn’t use the Rule of 40 to evaluate prospective investment opportunities. We understand that most early-in revenue, venture-backed startups tend to favor growth vs. profitability. In this context, looking too closely at the Rule of 40 may drive entrepreneurs toward misleading conclusions. The RO40 is, however, much more meaningful for more mature SaaS businesses, especially as they begin to enter the public realm.
What Is “The Rule of 40”?
The Rule of 40 states that, at scale, a company’s revenue growth rate plus profitability margin should be equal to or greater than 40%. SaaS management teams are often driving towards either rapid growth or increased profitability, and the Rule of 40 has become a construct for framing the balance of these two phenomena. Given that increased investment (whether from external or internal sources) is usually required to drive growth, rapid expansion and strong profitability are usually at odds with each other, and finding the right mix between the two can be tricky.
It is worth noting that the Rule of 40 will not help answer whether an early-stage company is growing fast enough or is profitable enough. There are other metrics and benchmarks to help us understand each of these questions. Rather, the RO40 is a measure of the balance between growth and profitability, and by extension, the sustainability of the business more broadly.
The Rule of 40’s Key Drivers: Growth and Profitability
The Rule of 40 equation simply sums two numbers:
- Growth rate %
- Profitability margin %
Let’s take a closer look at both.
Growth Rate %
While there are many different ways to measure growth rate, the easiest and most commonly used from company to company is year-over-year growth % based on GAAP revenue. GAAP revenue doesn’t lie (or it certainly shouldn’t) and provides the most consistent basis for comparison. While this is especially true for more mature SaaS businesses, early stage SaaS companies may be more focused on MRR or ARR growth. To be clear, these top line growth measures are perfectly fine to use when calculating your Rule of 40, with the one caveat that this may create an inconsistent basis for comparison between companies. In a perfect world, the way in which MRR and ARR are recognized would be as consistent as the methods for recognizing GAAP. Unfortunately, and especially in the early days, this is often not the case for many SaaS businesses.
Profitability Margin %
This part of the equation is a bit more tricky because there is no generally agreed upon measure of profitability. Unlevered Free Cash Flow, Cash from Operations, Net Change In Cash, Operating Income, and EBITDA are all different measures of profitability (the margin of which is calculated as a % of GAAP revenue) and legitimate candidates for use in the RO40 calculation (as the legendary Brad Feld wrote about several years ago). And what about stock-based compensation? Should these costs be included or excluded when calculating the RO40?
To be clear, there is no “correct” answer as to which profitability measure should be used when calculating and tracking the RO40. All of the above are valid. What’s important here is understanding that each measure of profitability will yield different results — and sometimes these differences are quite meaningful. For simplicity and comparability across companies, we use EBITDA excluding stock-based compensation (SBC) costs and will get into why a bit later in this post.
Let’s Jump Into an Example
The table below calculates the Rule of 40 for DocuSign’s (NASDAQ: DOCU) recently reported quarter, CQ4 2019:
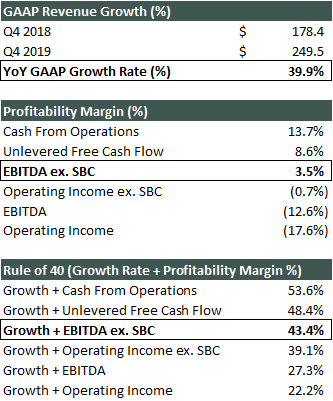
During the quarter, the Company posted YoY GAAP revenue growth of 39.9%. The Company’s profitability margin, however, varies considerably depending on which way you look at it. Of the six measures shown above, half point to net profitability (where the profitability margin % was > 0%), while the other half suggest that the Company operated at a loss during the period (where the Company’s profitability margin % was < 0%). Combining DocuSign’s YoY GAAP revenue growth % with the first three profitability margins would indicate that the Company would clear the 40% threshold, while the other three methods would point to the Company’s missing the mark — and in some cases by a wide margin.
To reiterate, there is no “right” or “wrong” answer (or measure of profitability) to use here. All of the above are valid measures, but each tells a different story. Some measures of profitability are more conservative than others and can make a meaningful difference in determining whether or not a company’s performance would land over or under the 40% benchmark. As we see above with DocuSign, the choice here can shift the RO40 profitability contribution from +13.7% (Cash from Operations) to -17.6% (Operating Income). The point here is to be clear about what you’re saying.
Using EBITDA excluding SBC costs as a profitability measure is, not unlike using GAAP when calculating growth rate, another way of creating a consistent basis for comparison from company to company. First, measuring profitability by using EBITDA smooths out differences in interest payments or depreciation of intangible assets when comparing companies. While these payments are generally trivial for early stage SaaS businesses that lack the cash flow to service outstanding debt, for more mature companies, these kinds of payments can have a meaningful impact on the bottom line.
Second, and perhaps more importantly, issuing stock to employees is a common practice at most software companies. Why? This is usually the most readily available currency that companies in this segment have at their disposal (especially those with exceedingly high cash burn). As such, at certain times of the year (e.g. bonus season), SBC expenses can be meaningful (and also inconsistent), which is why netting out SBC costs from EBITDA helps create a more consistent basis for comparison from company to company over time.
How Has the Rule of 40 Played Out In The Market Over Time?
Scale maintains a database of key metrics for – at the time of this writing – 68 publicly traded SaaS businesses. One of these metrics is the Rule of 40, calculated by using the method above: adding YoY GAAP revenue growth % + EBITDA margin % ex. SBC costs. The chart below shows the median Rule of 40 across all companies in our database dating back through 2011.
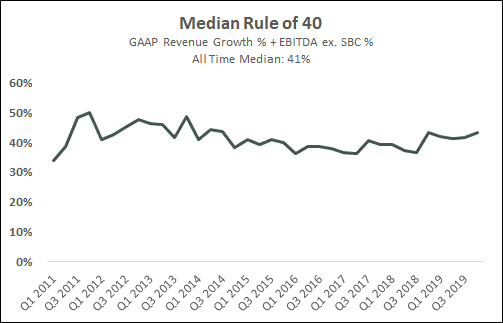
What becomes clear is that this measure has stayed rather consistent for nearly a decade, and not surprisingly, has converged around 40% (+/- a few percentage points) over this time horizon. The median across the last ten years has been 41%, which suggests that the Rule of 40 is in fact a good proxy for measuring the balance of growth and profitability for more mature SaaS businesses.
It is worth noting that the businesses in this comp set have all reached meaningful scale. The median annual GAAP revenue of this basket of companies during the stated time period is $185M, which points to considerable company maturity. The chart above would imply that the Rule of 40 is very fitting for this set of comps, though going back to our earlier disclaimer, one may argue that at different stages (especially in early development) and for different objectives, over-indexing towards growth or profitability may be the right thing to do for the business. In these cases, anchoring too closely to the Rule of 40 may draw management towards misleading conclusions. Nothing is valid without context.
Tying It All Together
The Rule of 40 has become a widely used unit of measure for understanding the relationship between a SaaS company’s growth and profitability. A ten-year look back of the data shows that the RO40 has remained quite consistent among public SaaS companies, suggesting that the measure is a useful barometer of the balance between a business’s expansion and profitability, and by extension, the general sustainability of company performance over longer intervals of time. We hope this post has helped bring some clarity to understanding some of the specifics around this measurement, which often go overlooked.
News from the Scale portfolio and firm