SaaS Metrics: To Understand Customer Retention, Start with Churn


You’re at a networking event when someone shares that one of your competitors has “Churn of 5%. They’re killing it.” Your heart sinks because you know your company’s churn is worse. Far worse.
Before you call an all hands meeting, though, ask yourself how that 5% was calculated. There’s a good chance that the churn rate calculation the competition used is quite a bit different from what your company is using.
Churn is one of those concepts that everyone in SaaS understands, yet there’s no real convention or common definition for how it is calculated and used inside a company. Measured correctly, churn is a key tool in your SaaS metric toolbox, effective at monitoring lost revenue and the first place you’re likely to spot a problem with customer retention.
That “measured correctly” part is the focus of this article. We’ll look at two ways that time impacts the accuracy of the churn rate calculation. It’s the first in a series of deep dives into churn and retention, building on the work done on Scale’s Four Vital Signs of SaaS framework.
What Churn Does and Does Not Measure
Existing customers are a growth engine. They tend to buy more over time (as long as you have more to sell them!), adding an important tailwind when your revenue base grows larger and your growth rate slows. Looking at it another way, the cost to secure a new customer is 5 to 25 times the cost to retain a customer.
My colleague Rory O’Driscoll published an article on how Scale evaluates SaaS company performance called the Four Vital Signs of SaaS. The Vital Signs are the four metrics that we’ve found to provide the most reliable signals about the health of a subscription revenue business. It’s what our team uses internally during due diligence and to help our portfolio companies navigate go-to-market and beyond.
The Vital Signs include a single metric in each of four areas: growth, efficiency, retention, and burn rate. They’re a starting point because:
- They aren’t meant to tell you everything (but they will highlight when and where deeper analysis is needed)
- They are meant to facilitate company-wide alignment on performance (easy to measure, track, and explain)
- They allow comparison across companies (making meaningful benchmarking possible)
Churn is a bit of a special case among the Vital Signs:
As growth slows the impact of churn escalates and provides an upper bound on HOW BIG a company can become. The simplest way to measure Gross Churn is by taking Churned ARR and dividing it by opening ARR for the period…[but] we acknowledge that this metric is a horrible oversimplification.
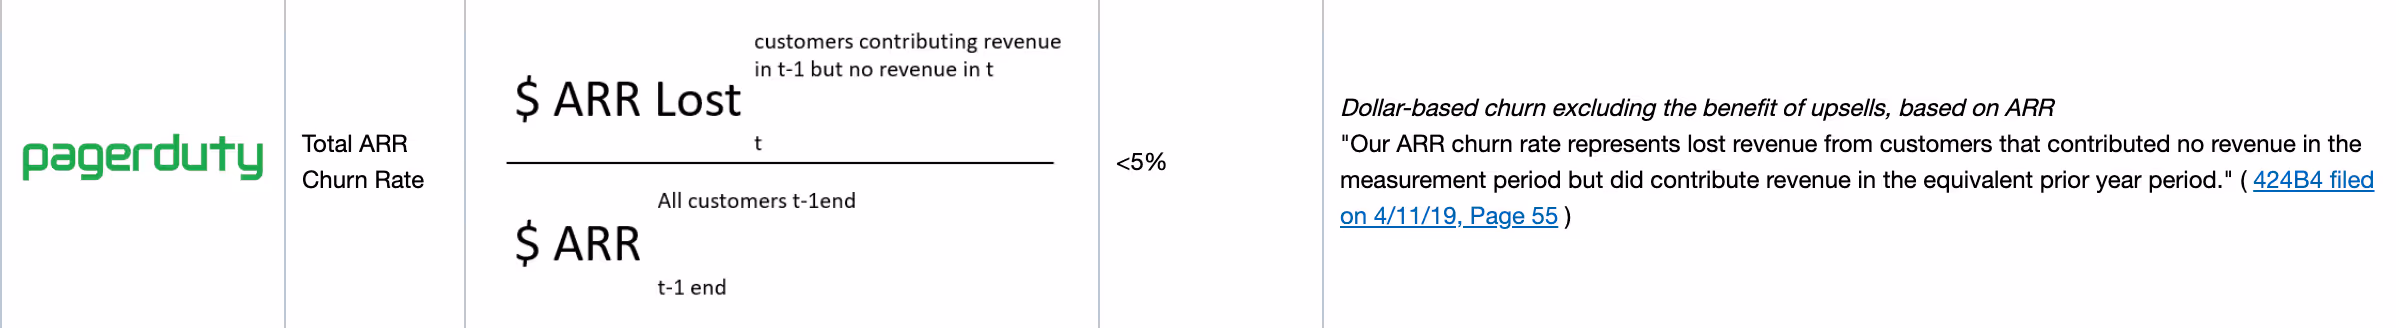
To see why selecting any one measurement standard for churn is an oversimplification, click through to this Key Bank research report on how public SaaS companies measure churn and retention. Of the nearly 100 companies listed, there are nearly 100 different measurement standards. By the time a company reaches that magic $100M ARR where an IPO is possible, they have (or should have) determined the best way to adapt the standard churn rate formula to their business model.
Churn is a tricky thing to measure because of two related aspects of time: measurement period and contract length. Let’s look at how each of these complicates the picture.
Time to Recalculate Churn
Churn tells you about lost business during a specific time period. It is related to customer retention rate, which tells you how effectively you held onto the customers who were eligible to renew (or cancel) during a time period. As we’ll see, churn and retention aren’t precisely the inverse but it’s ok to think of them that way as long as you understand the math behind how they’re calculated. So let’s get into that.
The Vital Signs Gross Churn calculation is straightforward: Churned ARR (quarter) / Beginning ARR (quarter).
Here’s a hypothetical ARR waterfall of an early-in-revenue SaaS company with its churn rate highlighted.
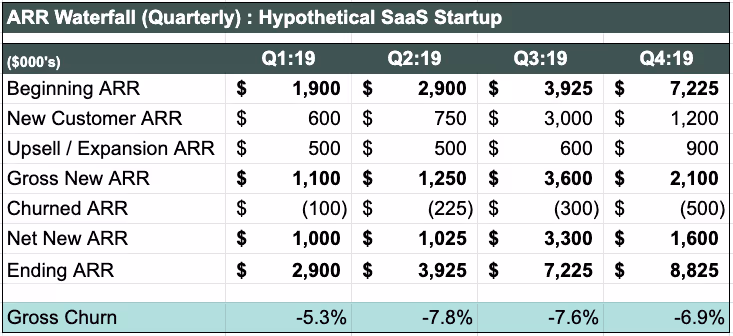
This company started Q1 with $1.9M in ARR, then lost $100k of ARR during the quarter, so its Gross Churn rate for the quarter was -5.3% — it lost 5.3% of its ARR base during that time period. Right?
That depends. We don’t know for sure because we don’t know the contract period the company offers its customers. One common mistake with churn rate is mismatching measurement period (month, quarter, full year) and contract length. To bring it back to the sample company, assume they offer monthly contracts. That means a quarterly Gross Churn calculation jumbles together 3 separate cancellation windows, all without adjusting the ARR in the denominator.
In general, any combination of mismatched measurement periods and contract terms will give you a lot less signal from your churn metric. A quarterly calculation for a SaaS business with multi-year contracts, to give another example, will tend to understate customer defections during periods when they can’t actually leave.
Let’s go back to the model company’s ARR Waterfall stated by month. Assume that it offers month-to-month contracts, which means the full ARR base is eligible to continue doing business or cancel every month.
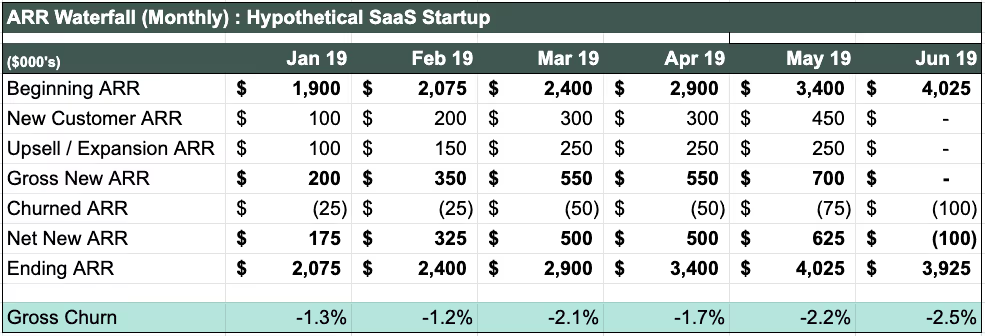
The monthly Gross Churn data now accurately reflects the actual rate of customer churn. It also makes clear why the quarterly Gross Churn rate (from the first waterfall above) was misleading. The quarterly churn calculation was using an “outdated” Beginning ARR for 89 more days than it was accurate. By not accounting for new ARR, the denominator was smaller than reality and thus churn appeared worse than it was.
It’s an easy fix: set your measurement period (monthly, quarterly, yearly) equal to your contract period (monthly, quarterly, yearly). By doing so, your Beginning ARR balance will always equal the amount of ARR up for renewal during the measurement period. This gets messy if you sell multiple contract lengths, but it’s possible with a much more complicated spreadsheet.
Put another way:
When your contract period equals your measurement period, your churn rate provides an accurate count of the $ disappearing from your ARR base during that period.
Next Up: Getting Even More from Churn
We’ve looked at how time impacts the accuracy of the churn calculation. The next article in this series will detail how to adjust the churn calculation to avoid common measurement errors. And we’ll use SaaS company performance data from Scale Studio to get specific about what “good” churn looks like at different stages of growth.
Read Part 2 of this series here.
News from the Scale portfolio and firm