Slowdown Mirrors Public Markets: Flash Update Follow-Up


In this post, we’ll be expanding on the churn, new customer, and upsell ARR analysis from the Q123 Flash Update and take a look at Net Dollar Retention and public company trends.
Candidly, our team was hesitant to hit “publish” after reading through the Q123 Flash Update last week. The data wasn’t positive, and it didn’t look good for enterprise software startups. We had to know: are the plan attainment and growth slowdown issues we see isolated to the private markets? Or are they happening throughout the broader software ecosystem?
In the end, we decided to share our findings. We’re committed to sharing our analysis quarterly, so we shouldn’t stop when we don’t like what we see. Plus, we think the analysis is useful to our readers – even if the data itself doesn’t paint the rosiest picture. By seeing how other companies are faring, founders can better calibrate their own performance and plans for the year ahead.
In the week since we did our initial analysis, we’ve become more confident that the trends we saw in that Flash Report extend beyond our own portfolio. Let’s look at public versus private performance leading up to last quarter and expand our analysis of the issues underlying the Q123 slowdown in growth and plan misses.
Public SaaS companies are also experiencing a slowdown
One of the biggest questions on our minds was whether or not the slowdown we saw in Q123 was isolated to private companies. The past month has been mixed in public markets, with some companies spectacularly beating their plans while others struggled to make the quarter and revised their 2023 plans down. There’s also the continued regional banking crisis and looming debt ceiling deadline that are filling markets with uncertainty.
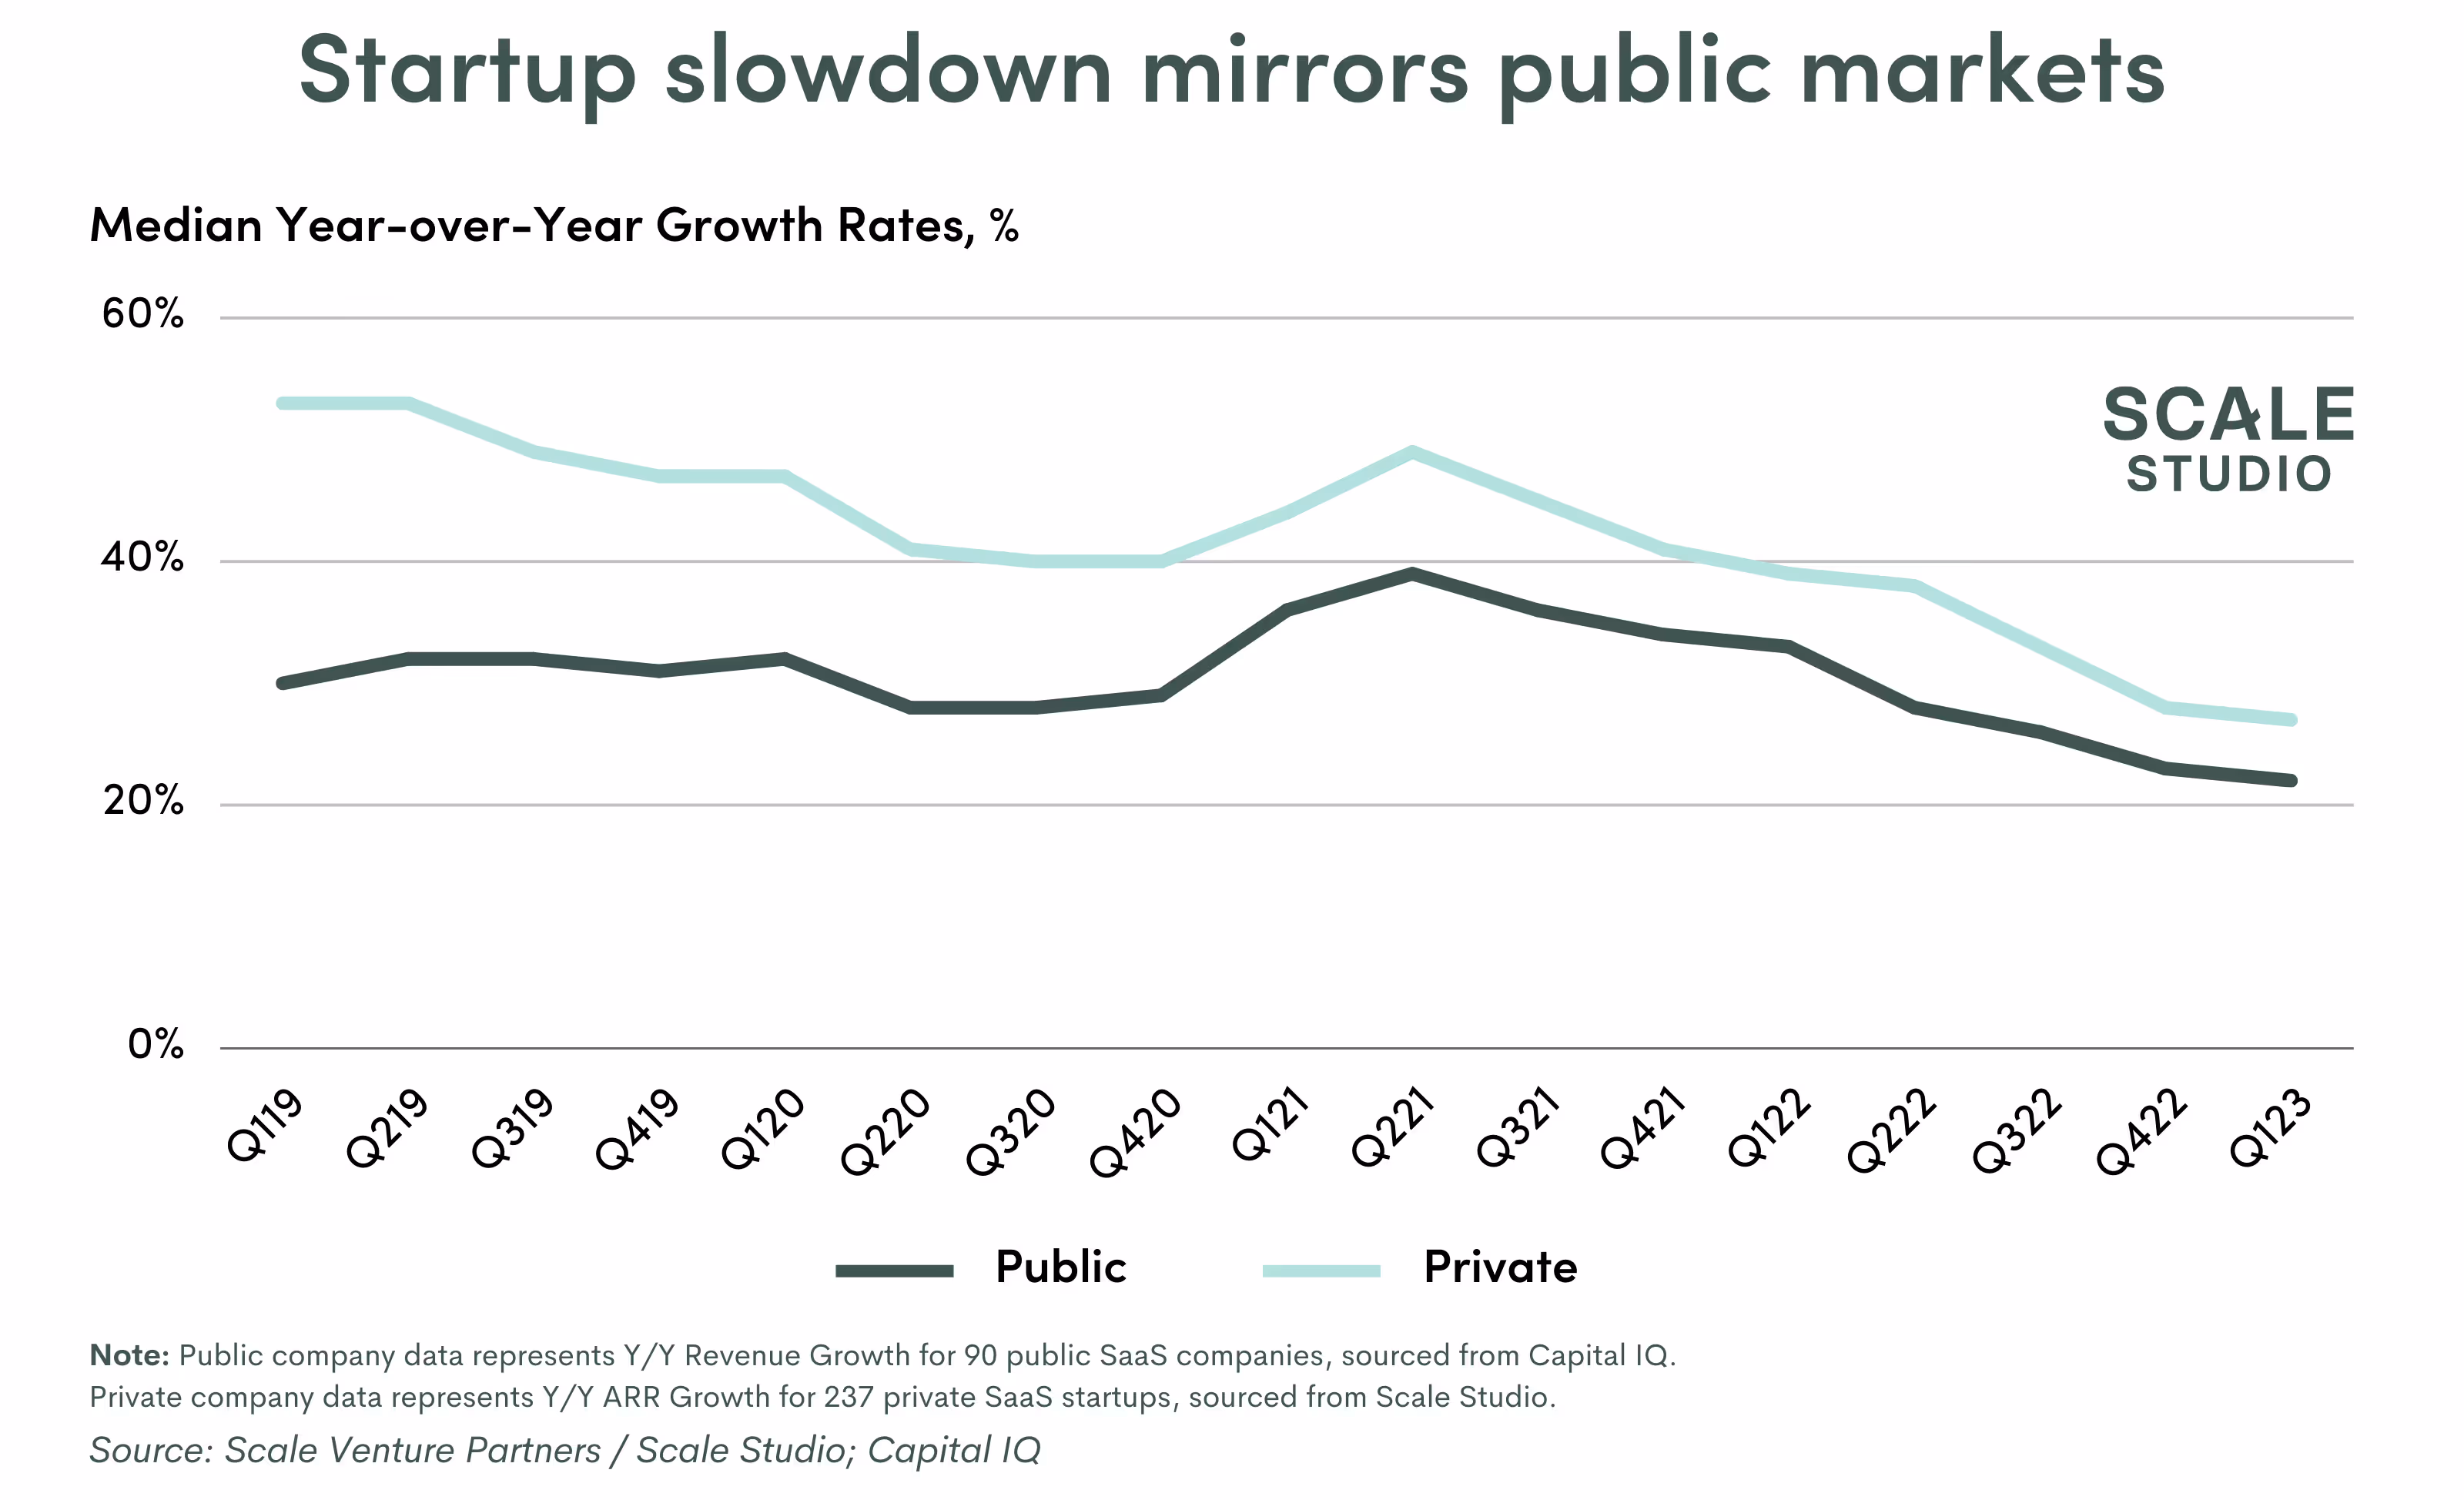
We expanded our startup growth rate analysis from the Flash Update to include all companies in Scale Studio and compared it to a benchmark set of 90 public SaaS companies that we track. Looking at the graph above, the two lines follow a nearly identical path from Q119 to Q123, with startups having consistently higher growth rates (as expected). It seems the struggles we’ve seen across enterprise software startups match what we’re seeing across public tech companies.
NDR could be driving the slowdown in both public and private markets
To get a clearer picture of why both public and private companies have been struggling, we took a look at companies’ Net Dollar Retention. NDR is useful to compare the performance trends between startups and public companies since it’s one of the few non-GAAP measures that public SaaS companies report on a semi-regular basis, and focuses on upsell and churn – two of the main potential drivers of the decrease in growth.
For public companies, we looked at over 60 SasS companies included in Meritech Capital’s Public SaaS Comps and dug through SEC filings and earnings calls to identify their NDRs back to 2019. For private startups, we looked at ~250 private SaaS startups in our Scale Studio data set from 2019 to 2023.
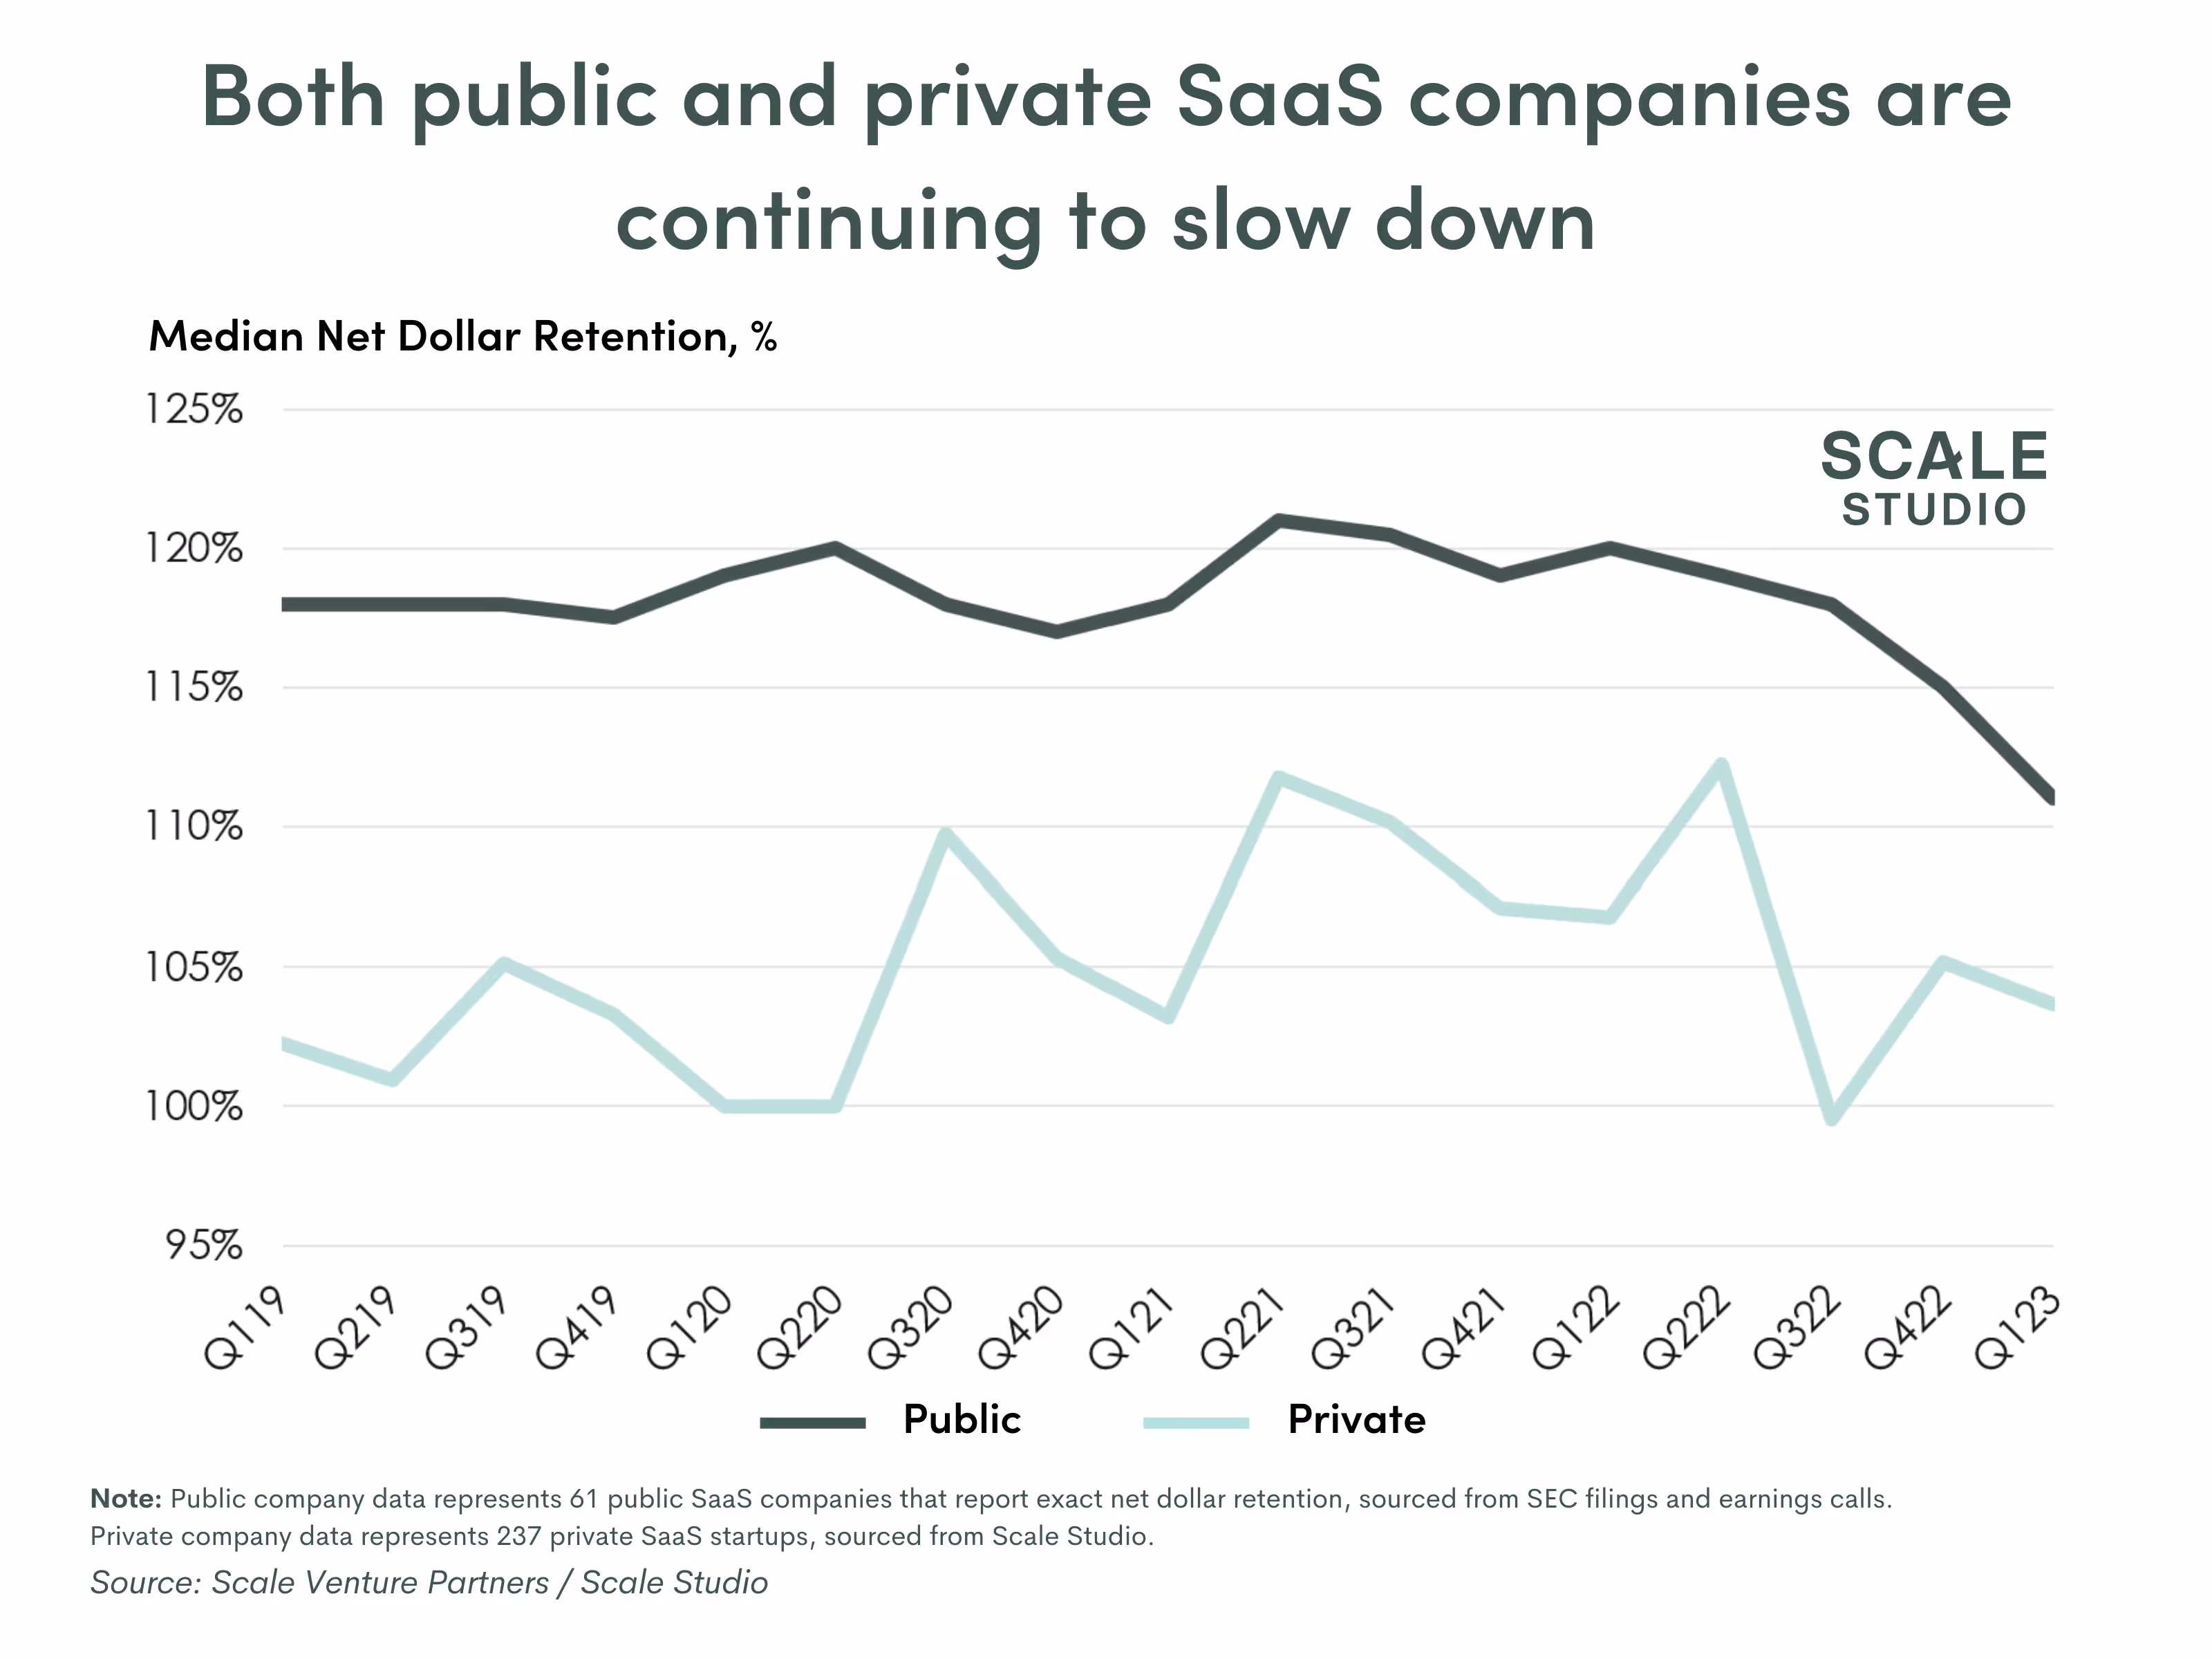
We can clearly see above that public tech companies are seeing similar drop-offs in NDR to private SaaS startups. The median public SaaS NDR has fallen 10% from 121% in Q221 to 111% in Q123. While it’s a bit bumpy, the median NDR for SaaS startups has fallen a similar amount – down 8% from 112% in Q221 to 104% in Q123.
Now, since NDR combines both churn and upsell (and public companies rarely break those two apart), we need to take a closer look at each of churn and upsell individually where we can.
Churn hasn’t spiked (so far)
Building on the churn analysis in the Flash Update, we expanded the dataset to all companies in Scale Studio and opened up the aperture to look at performance from 2019 to 2023.
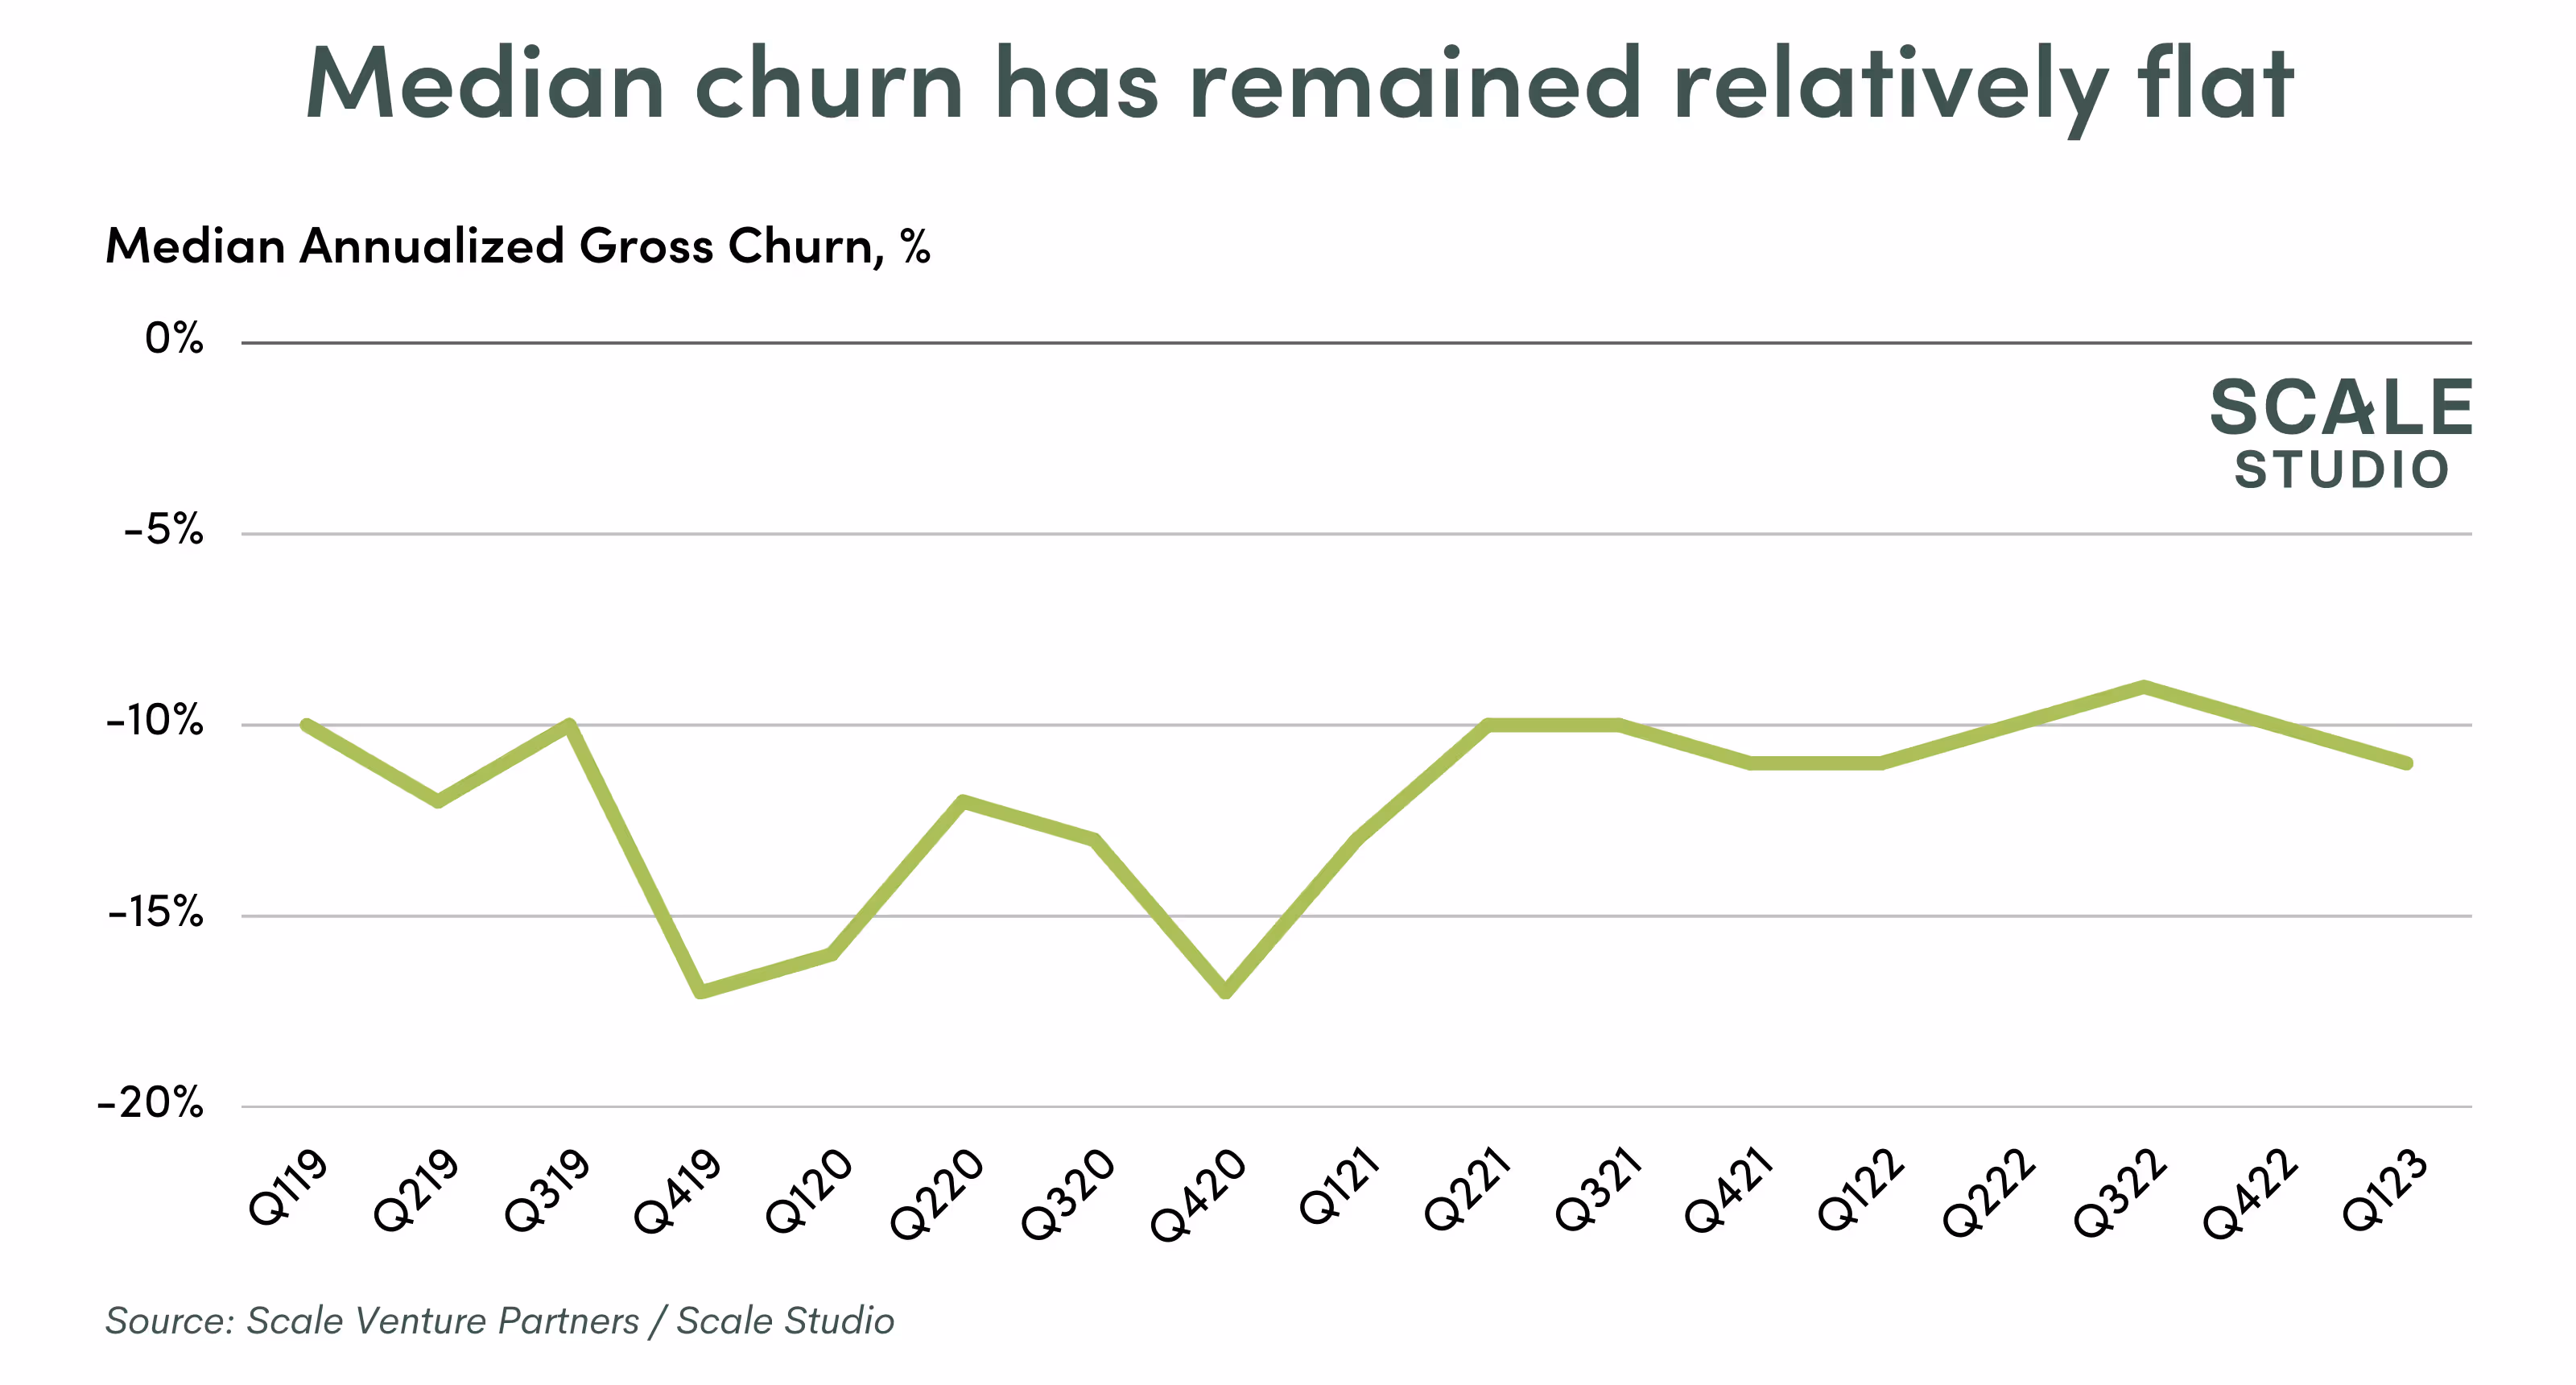
Internally, we had initially expected an uptick in churn in Q123 as companies focused on cutting their cloud spend (we even made an investment in the cloud cost optimization space). As you can see below, churn actually seems to have improved relative to late-2019 and earlier in the pandemic, and stayed flat since early 2021. While companies may have continued optimizing their spend, it doesn’t seem that was driven by completely churning off of their existing services.
Companies decreased new software spend
Similar to the churn analysis, we expanded the new customer and upsell ARR analysis to include more companies and 2019 data.
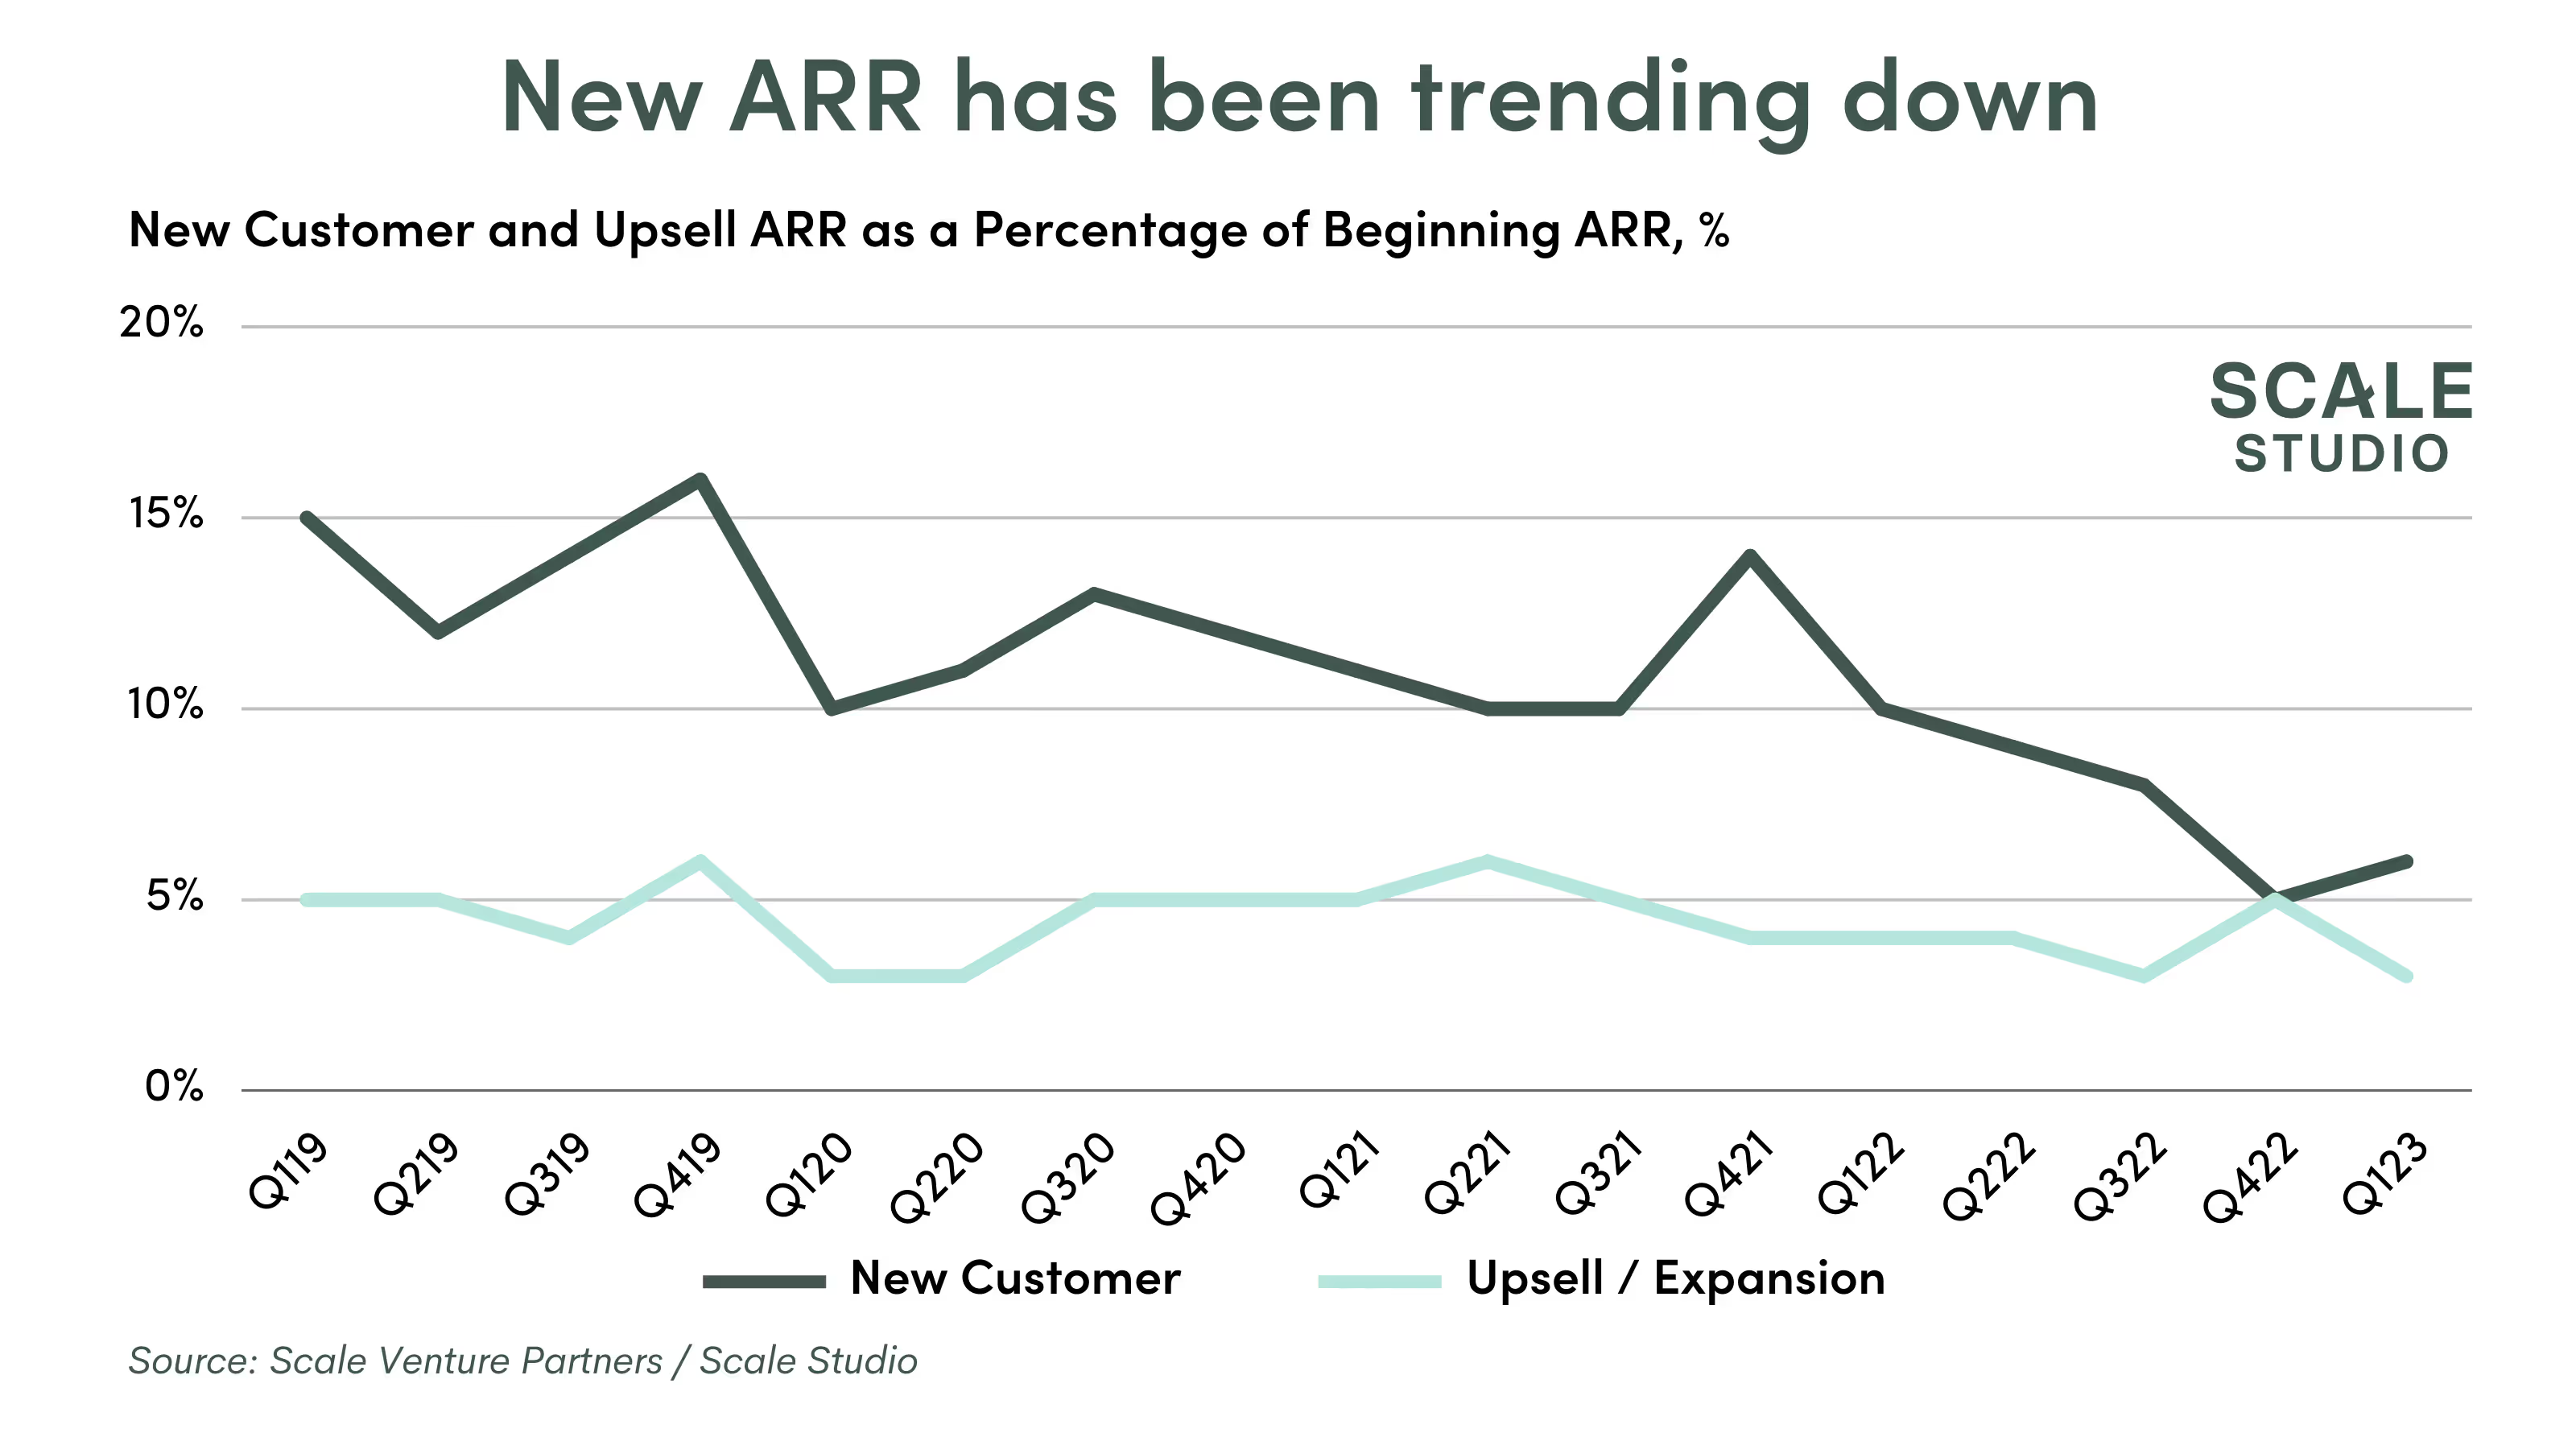
Including the 2019 data in the graph here really makes the trendline jump out. New Customer ARR has fallen from being ~15% of Beginning ARR per quarter in 2019, to hovering slightly above 10% throughout Covid, to now being in the mid-single digits. Upsell ARR has been relatively more stable, but throughout 2022 and now in Q123 upsell has also seen a drop off.
It seems companies are optimizing their spend by pushing back new spend (which should have been expected), leading to less upsell, less pricing power for sellers, and longer sales cycles – all of which contributed to the lower plan attainment we saw in Q123. Additionally, with the rise in usage-based startup revenue models, we’ve heard customers are significantly reducing their usage and number of seats – but not fully churning out – which would also drive down new ARR.
With Q123 behind us, we’ll have to see how companies revise their plans for the year and adjust to the large miss we just saw. Will companies come roaring back in Q223? Or will we be in for another round of “cut the burn” discussions as growth continues to fall flat? We’re hoping for the former.
Note: For this post we expanded the data set to include all companies in Scale Studio and new Q123 data, so the numbers above may not exactly match our Q123 Flash Update.
News from the Scale portfolio and firm