The Wonder Years of SaaS: Balancing Growth and Sales Efficiency


In our previous article, we talked about the History of the Magic Number and looked at how, for private companies, this measure of go-to-market efficiency has changed over time in relation to changes in public market revenue multiples. We found that during periods when public market revenue multiples were high, there was a corresponding degradation of private company Magic Numbers and vice versa. We hypothesized that this behavior is largely driven by pre-IPO growth companies pushing to reach escape velocity while the IPO window is open.
In this article we’ll take a more granular look at this trend with the goal of giving founders a better understanding of two key levers: growth and sales efficiency. We’ll do this by looking at how the Magic Number changes for companies with different growth profiles and revenue scale.
Using Scale Studio, we assembled a sample of nearly 2,000 data points from private and public enterprise software companies from 2010 to 2020, ranging in size from $1M to $200M+ in run rate revenue. We then analyzed the relationship between growth rate and Magic Number. When viewed as a whole, the data confirms that the long-term median Magic Number is right around 0.7. Even when there has been movement higher or lower, there has always been a reversion to the mean.
Now let’s bring in growth to the picture.
The Flywheel Effect of Growth
CFOs will tell you that one of their key questions in the annual planning process is, “How fast should we grow and how much are we willing to burn to get that growth?” Embedded in that question is the supposition that high growth requires high burn and, in turn, degraded sales efficiency.
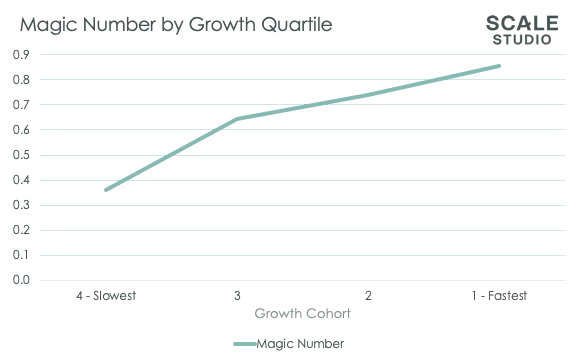
CFOs are generally correct with those assumptions. But is it always true that growth comes at the cost of sales efficiency? To answer that, we looked at the companies in our data set by growth rate quartiles, with the 1st quartile being the fastest-growing companies and the 4th quartile being the slowest. Then we looked at the median Magic Number for each growth quartile to see if the concerns were warranted.
What emerges in the analysis may at first seem counterintuitive: Faster growing companies tend to have higher Magic Numbers than their lower-growth counterparts.
But let’s think about this a little more. There’s a bit of a flywheel effect in play here. Those companies that grow quickest have found true product market fit, allowing them to raise funds easier, which further fuels the engine of growth. They continue to invest in sales and marketing to scale the business with little-to-no degradation in sales efficiency.
Important cautionary note: Spending more money to grow faster does not necessarily net you a higher Magic Number. So, unfortunately, this is not the elusive perpetual motion machine we’ve all been searching for.
Now let’s bring revenue scale into the picture.
Size-Adjusted Magic Number
We intuitively know that growth rates differ based on size. After all, a $1M company should have different growth expectations than a $50M company. But what about sales efficiency? We know that large public companies have hovered around the 0.7 Magic Number, but what about private companies at different stages of growth?
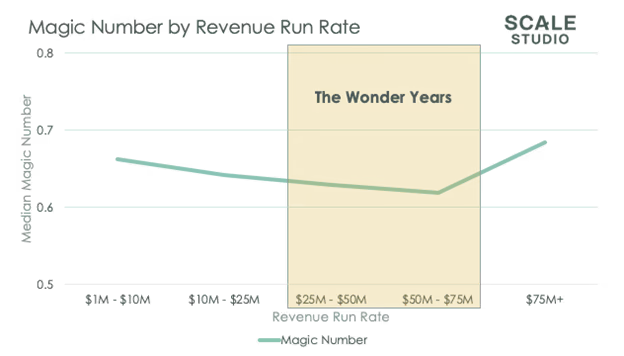
While largely falling within the expected range, we do see a degradation of the median Magic Number beginning with the $25M – $50M band and becoming more pronounced in the $50M – $75M band. This aligns with our hypothesis that those companies in the pre-IPO growth stage really start to step on the gas, often leading to lower Magic Numbers.
Let’s connect this data to what’s going on inside companies at these different stages.
Welcome to the Wonder Years
Congratulations, you’ve made it to the rare air of $25M! Many companies have folded before reaching this milestone. But there’s still a long road ahead. And, much like many teenagers, for companies at this stage there’s often a rush to advance to the next stage. Let’s stick with this metaphor for a moment.
One milestone for many teens is moving out of their childhood home to live independently. For startups, the prospect of leaving the relatively protected private market for the public market is alluring — yet scary at the same time. This threshold moment comes when growth is still very high: Scale Studio forward growth benchmarks show that top-quartile companies will double at $25M and then grow by another 60% the following year, putting them within $20M of the magical IPO-ready $100M threshold.
And much like teenagers, companies are at different stages of readiness for this move. Some have the operational maturity to do it in this two-ish year timeframe and others take many more years — and sometimes decades — to get there. If they ever do. There are a host of reasons why companies might not be ready, including lack of true product-market fit, unprepared leadership, or worst of all, a market that just isn’t big enough.
Here’s the same data in table form, with the Wonder Years highlighted.
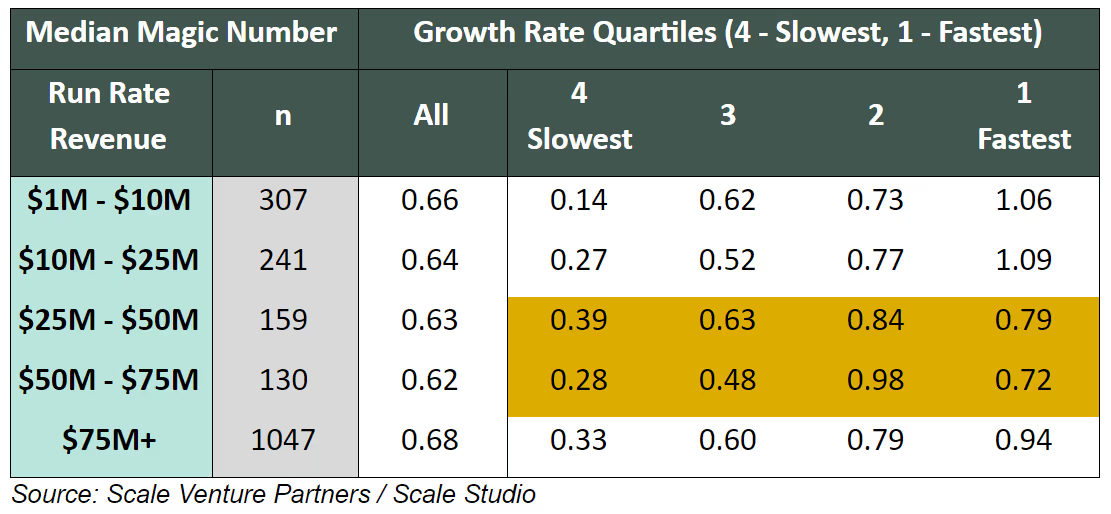
In the words of the famous early education expert, Big Bird, “One (or two) of these things is not like the other.” Each cohort shows the same trend. The fastest growing companies, those that have found true product market fit and can scale their go-to-market models, tend to have higher Magic Numbers when compared to their lower growth compatriots. Those fast-growth companies have earned the right to grow at that pace based on their Magic Number.
And it’s true for all size bands except during the Wonder Years ($25M to $75M) where companies are pushing for growth at extraordinary costs in order to get to sufficient scale to reach the next stage. Sure, there are companies there that continue to grow efficiently, but the 1st quartile of growth companies at this stage are markedly less efficient when compared to the 2nd quartile of companies.
Should You Go For It?
When is the push for IPO the right decision? Is it better to ease off the throttle to add another few months or years to reach the same place but with higher efficiency?
Those are hard questions to answer in general. Every company’s situation needs to be contextualized.
There are certainly scenarios where the push absolutely makes sense. Perhaps there is heavy competition and strong “stickiness” once the product is deployed. Perhaps a company has reliable access to cheap capital and formulates a strategy to return to a highly efficient model after the push.
Just recognize that any decision of whether and when to push hard to achieve escape velocity will come with tradeoffs. Everything from dilution caused by capital in-efficiency to, far worse yet, getting stuck with an inefficient model when the cash runs dry.
Sam Baker contributed to the research and writing of this series.
News from the Scale portfolio and firm