SaaS Metrics: Diagnose Customer Loss with Renewal and Retention Rates


The first two articles in this series looked at how to use the Churn rate metric to spot a customer retention problem, then presented adjustments to the Churn rate calculation that better capture your company’s operational realities. This article looks at the metrics that you’ll use to analyze churn issues: Renewal and Retention rates.
This article starts with an overview of Renewal and Retention rates, then looks at how to use each to examine different aspects of customer renewal behaviors. We’ll end with a preview of the final part of this series, a downloadable Cohort Analysis template.
The Yin and Yang of Customer Retention: Churn and Renewal
Churn measures the volume of dollars or number of customers that your business lost during a given time period. Tracked over time, the Churn rate provides big-picture insight about customer loss. Go here to see churn benchmarks for SaaS startups as they grow from $1M to $100M.
The Renewal rate measures dollars or customers retained during a time period, limited to only those customers that were eligible to renew during the period. Renewal rate’s superpower is that it gives you a snapshot of whether customer decisions to renew or cancel went for or against you.
Since we started this series focused on Churn rates, we can talk about Renewal rates in terms of Churn. When you set the period in which you are measuring churn equal to your contract length, your Non-Renewal Rate will equal your Churn rate. The Renewal rate, then, is simply the inverse, or (1-Non-Renewal Rate). So a Non-Renewal Rate of 7% equates to a Renewal rate of 93%.
From your first dollars of revenue, you should be tracking both Churn and Renewal rates. You’ll share Churn data to coordinate Sales, Marketing, and Customer Success. And when (if!) Churn starts trending against you, you’ll lean on Renewal rates to tell you a lot about “why?”.
Defining Gross and Net Renewal Rates
Now for the definitions.
Gross Renewal Rate shows you the dollars that renewed as a percentage of all dollars that were eligible to renew during a period. It is calculated by adding the total renewed contract dollars then dividing by the total dollars that were eligible for renewal. That looks like:
Gross Renewal Rate = Dollars renewed/Dollars eligible to renew
Net Renewal Rate tells you about the growth of your existing customer base by including net expansion (upsell – churn – downsell). Eligibility is calculated using contracts that expired during the time period. That looks like:
Net Renewal Rate = (Dollars renewed + dollars expanded)/Dollars eligible to renew
Big picture: renewal rates are measured using the “end state” of a time period. It tells you how many customers/dollars renewed as a percentage of those that could have renewed. It’s your contract renewal batting average.
The Difference Between Renewal Rate and Retention Rate
If Renewal rate is a snapshot in time, Retention rate is a trend over time. Retention rates tell you about the renewal decisions of a group of customers that signed up at the same time and how many of those customers remained customers over time.
“Renewal” and “Retention” are often used interchangeably. They shouldn’t be. To analyze either requires you to group your customers into cohorts, or groups of customers that share specific traits like when they signed up or when they last renewed. How you define membership in those cohorts is what distinguishes the two:
- Renewal rate examines customer cohorts defined by the end date of their contracts
- Retention rate measures starting cohorts (customers that signed up during the same period) through the life of their contracts
That distinction has implications for what Renewal and Retention rates tell you and how to use them. Here’s how it shakes out:
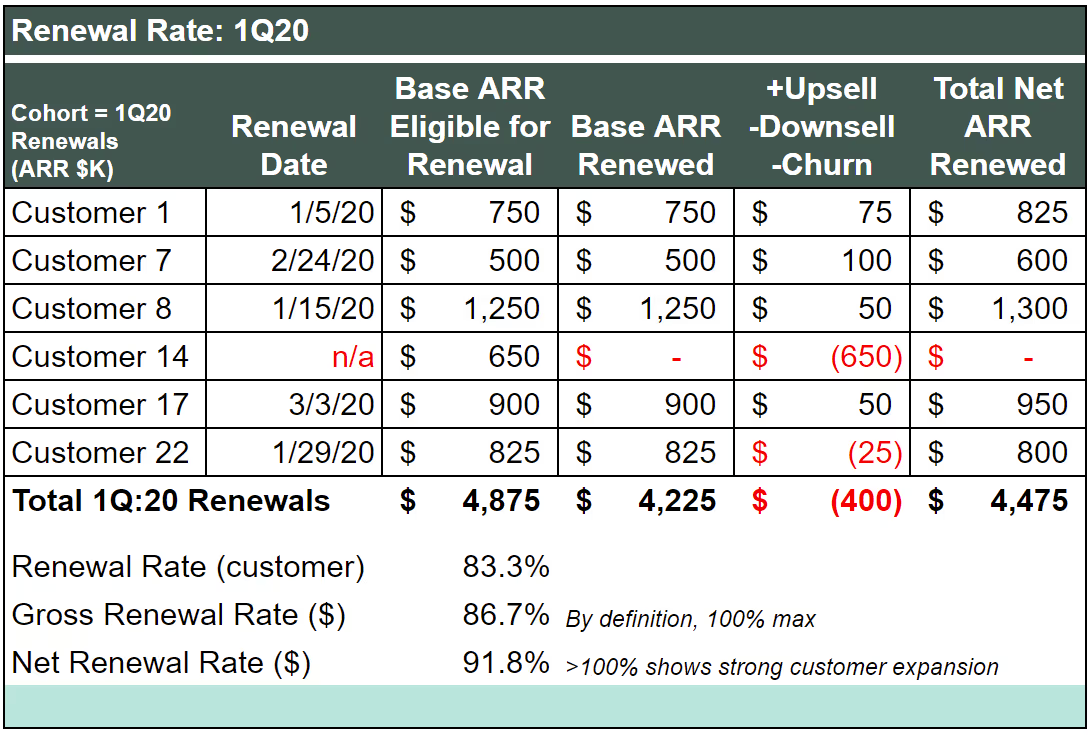
Renewal rate tells you how many customers re-signed at the end of their contract. In practice that means listing out all the customers that renewed during a period, ignoring contract start date.
The Renewal rate is the best count (customer or $) of whether customers said yes or no when their contracts came up for renewal. Here’s a look at how to set that up:
Retention rate shows you how well you’re keeping customers that signed up during the same period. The Retention rate shows how customers that started at the same time buy more and/or increase adoption. On a dollar basis, it shows how much an initial $1 in sales has grown after a specific amount of time. So, for example, how long it takes customers that signed up in the same period to grow from $100K to $150K in ARR.
Here’s a simplified view of retention tracking. It illustrates the common early-stage challenge of retention dollar decline caused the impact of customer loss on a small base:
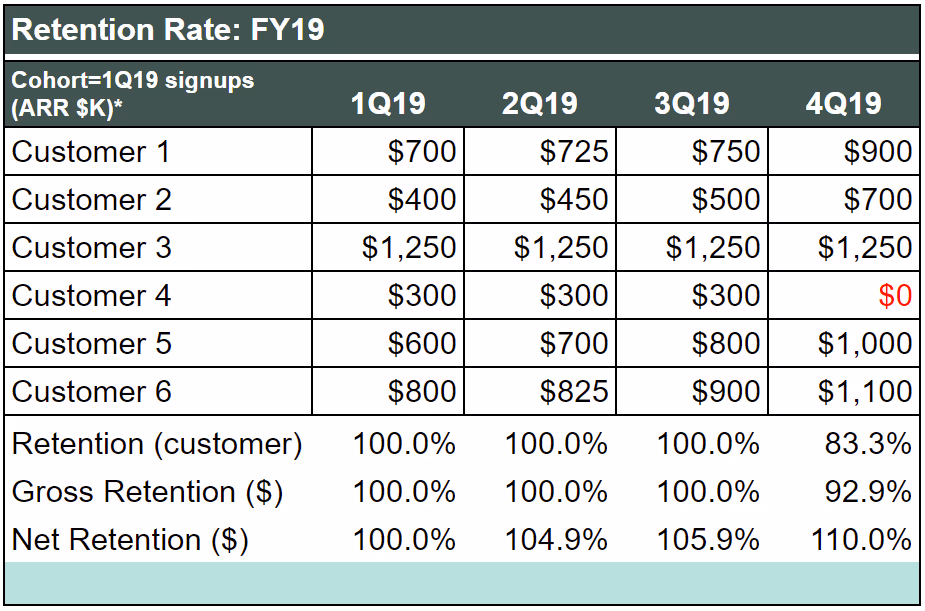
A few notes on the table. These six customers signed annual contracts in 1Q19; that column shows the initial contract value. Expansion during a quarter represents upsell like adding seats or services to the existing contract. Finally, we’re measuring dollar retention using the starting 1Q19 contract value rather than adjusting to the beginning ARR each quarter (though that calculation too can give you a useful view of the same data).
SaaS Customer Retention Tracking
For SaaS businesses, it’s the trend that often matters most. And, by definition, trends become clearer with time and data.
Enterprise-focused SaaS companies typically sell annual contracts, which means they don’t see much signal from renewal tracking until lapping the first batch of renewals. And even then, the renewal decisions of those first customers tend to be outliers that don’t predict the longer-term trend.
On the other hand, don’t get lost in the data until you have accumulated enough of it to reach reliable conclusions. We see a lot of early-stage companies adding complexity to their renewals tracking too early. It’s better to start simple and build.
In the early innings, you can get by with a spreadsheet consisting of columns for each customer (logo) and it’s first quarter of ARR contribution. Then add columns each quarter to track each customer’s ARR progression.
But you have to start somewhere, so start with the following two approaches to get initial insight into your renewal situation. Consider them placeholders until enough time has passed for you to accumulate more data.
Current Quarter Proxy. When you don’t have much historical data, use your current quarter as the proxy for your forward projections. That looks like this:
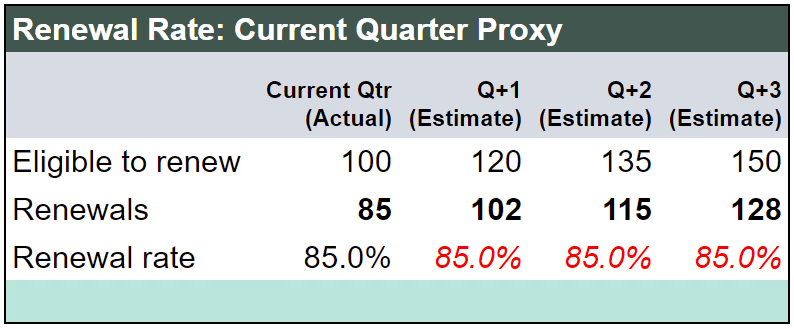
Just don’t project out too far — at even the best performing startups, Renewal rates bounce around from quarter to quarter in the early innings.
Once you have a few quarters of renewal rate data, you can start using a weighted average in your planning and projections.
Weighted Average. Grab as many periods of renewal data as you have, then average them to generate an estimate for your current Renewal rate.
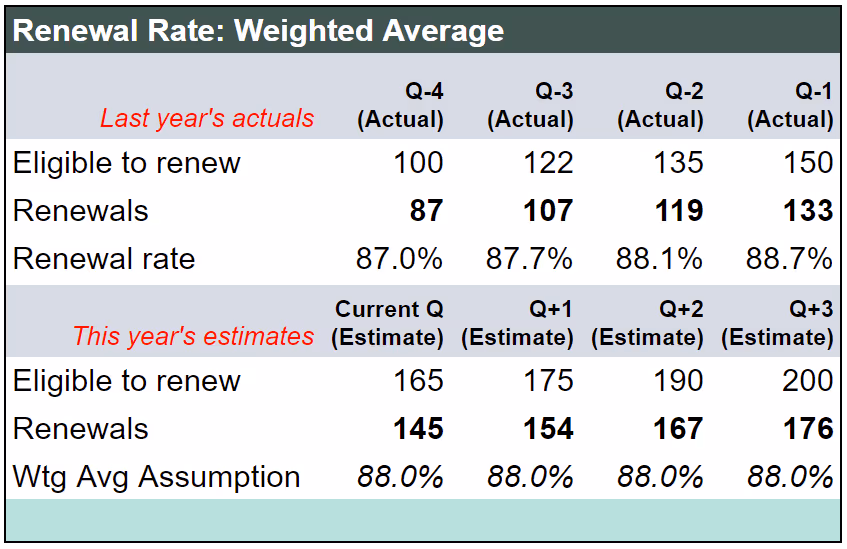
Weighted averages won’t provide insight into the impact from things like new product features (which may or may not meet customer needs), new Marketing programs like content campaigns (which may or may not provide value to customers), or new Customer Success initiatives (which may or may not provide value to your customer segments). But it’s a good stopgap until you accumulate more data.
Cohort Analysis
What you’re working towards with Renewal and Retention tracking is cohort analysis. A cohort analysis has two steps: grouping customers into cohorts defined by beginning or ending traits, then tracking how those cohorts behave over time. The analytical gold is seeing how well your company is expanding its customer relationships by, for example, looking at how $1 of initial ARR grows over time.
This is important because great cohort expansion relieves some pressure from your sales efficiency. When customers consistently become more valuable over time, the cost to acquire those customers is no longer the sole metric that determines ROI on selling. Net dollar retention growth captures not just sales efficiency, but customer success upselling and even marketing’s impact on increasing usage and expansion.
The final release in this series is a Cohort Analysis tool, a downloadable template for getting started with renewal and retention tracking.
Sam Baker contributed to this article.
News from the Scale portfolio and firm