SaaS Metrics: The Growth Rate Mirage


For a business leader looking to raise venture funding and successfully manage the day-to-day operations of their company, knowing how to answer the question “how fast is my business growing?” is absolutely crucial. And calculating a growth rate should be easy, right? In our experience, though, we have found the opposite to be true and believe that properly measuring the growth rate of an early-stage SaaS business can be unexpectedly difficult: like optical illusions, growth rate calculations can play tricks on the mind.
Therefore, we embarked on a journey to identify what we believe is the most accurate way to calculate a SaaS growth rate and settled on what we now call the Scale iCAGR (instantaneous compounded annual growth rate). Using such a firm wide metric allows us consistency in the diligence process, enables better benchmarking of our portfolio companies, and helps us more rationally set valuations in a world where they too often appear to materialize out of thin air.
Take this example: Several weeks ago I met with the CEO of a 7.7M ARR Run Rate company (modified numbers below) who claimed his company was experiencing 127% ARR growth (2Q 2016 vs. 2Q 2015).
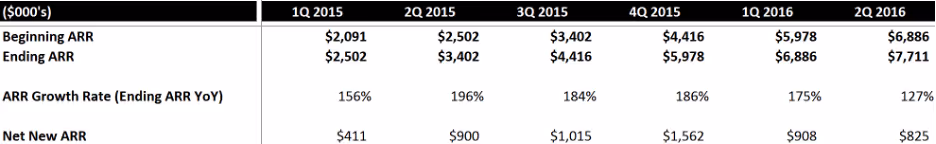
In fact, based on our research, we would strongly argue that these numbers suggest the company’s true growth rate in 2016 Q2 is actually closer to 50%, and the 127% is a vanity metric.
How is this possible? It’s not a calculation error or Excel mistake; rather this bizarre numerical phenomenon is fairly common across early-stage SaaS businesses when a company’s growth trajectory changes dramatically over a small window of time. Essentially if you remember your high school calculus, the growth rate mirage comes down to distinguishing between the average rate of change (YoY) and the instantaneous rate of change.
The birth of the Scale iCAGR
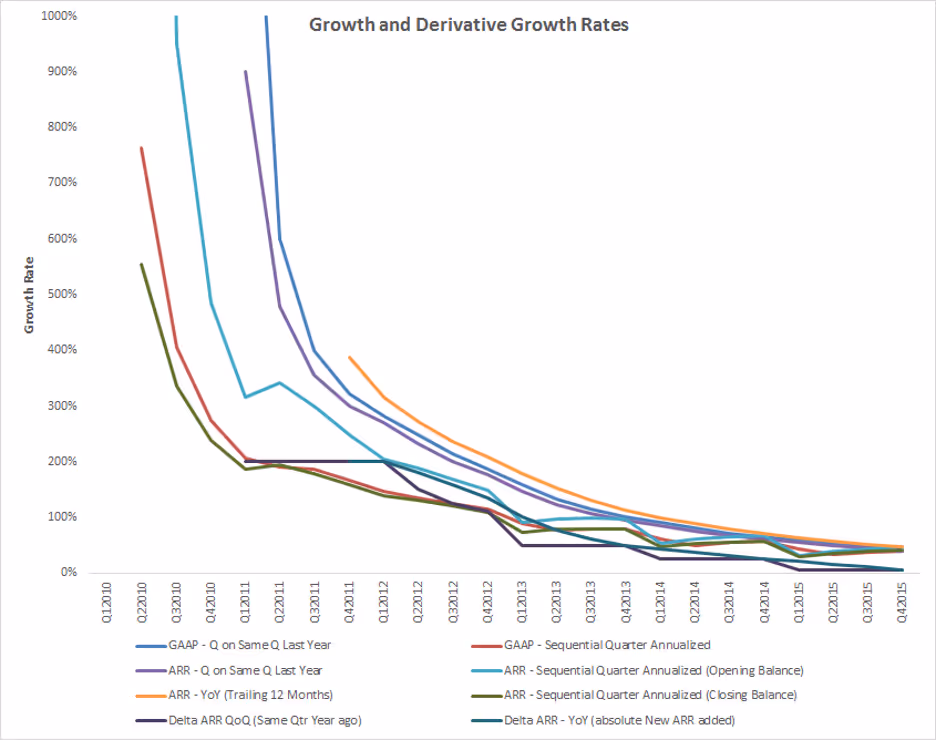
When we first kicked off our growth rate research, Dale Chang, our VP of Portfolio Operations, outlined a number of potential ways to measure a company’s growth rate across several dimensions. We could measure various traction metrics (e.g. GAAP Revenue, Ending ARR, or Net New ARR) across a variety of time dimensions (Quarter-on-Same-Quarter measures like Q2 2015 vs. Q2 2014; sequential quarter annualized measures like Q1 2015 vs. Q2 2015; or we could measure the trailing twelve months vs. a one year look back). Below is a chart of the options we ultimately considered.

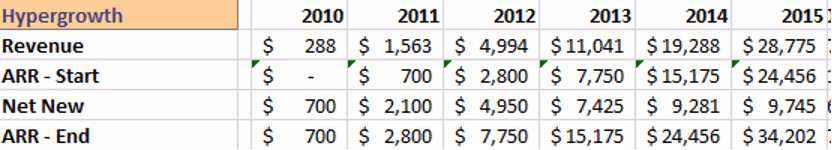
Next we modeled several common scenarios we typically see in the companies we meet: hypergrowth, slow roll/ steady growth, and growth with large seasonal affects. We wanted to know how the various growth rates shown above would differ at various stages of a “sample company.” For the sake of brevity, we only show one of these scenarios (hypergrowth) below.
What We Learned
- Variation across the numerous definitions of growth rate is usually most extreme when a company is in its early days. Once a SaaS business reaches a later stage where growth is more stable, the various growth rates converge. For example, in Q4 of 2011, (when the company was at a 2.8M ARR run rate), it is growing somewhere between 158% and 387% depending on the definition used. This is a substantial gap! Compare this to a more mature version of the company where the same 2 metrics in Q4 2015 (when the company is at a 34M ARR Run Rate) yield 42% and 47% respectively.
- We had to be consistent in choosing one measurement to be used across our firm. Given the wide variation in growth rates as shown above, if every person at ScaleVP used a different measure of growth, we would never be able to make apples-to-apples comparisons of various deals under consideration. This same principle applies on the operating side as well.
- High school calculus has real-world business applications: Thinking in terms of calculus, Q-on-Same-Q Last Year (2015 Q2 vs. 2014 Q2) growth represents the slope of a line drawn between two distant points (the average growth rate) while annualizing sequential quarters (2015Q2 vs. 2015Q1) is more analogous to the derivative (as defined in calculus) which represents instantaneous growth at a specific point in time. This is why we have named this particular growth measurement the Scale iCAGR
Ultimately, we chose to use the Scale iCAGR (sequential quarter annualized metric) as it is a more forward looking growth rate than the Q-on-Same-Q Last Year metric.
The Scale iCAGR= [1+(Net New ARR in a Quarter/Ending ARR of that Quarter)]^4-1
Compared to other growth rates, the iCAGR slows first and could even go negative (if churn exceeds gross new ARR) even if a company still has positive GAAP growth. We are still trying to tease out what we can extrapolate from a declining iCAGR beyond that it is bound to happen and like the forces of gravity, decline is nearly impossible to overcome. As Andy Vitus describes in his post on growth persistence, in recurring-revenue companies next year’s growth rate is likely to be 85% of this year’s growth rate.
However, the best use of the iCAGR is not as a standalone metric; but rather alongside others that we have previously referenced on this blog including magic number and growth persistence. Keep in mind that the iCAGR for a 1M Run Rate company will look very different than the iCAGR of a company at 5M or even 15M run rate so iCAGRs are only worth comparing for businesses at similar run rates.
Which brings us back to our example and the growth rate mirage:
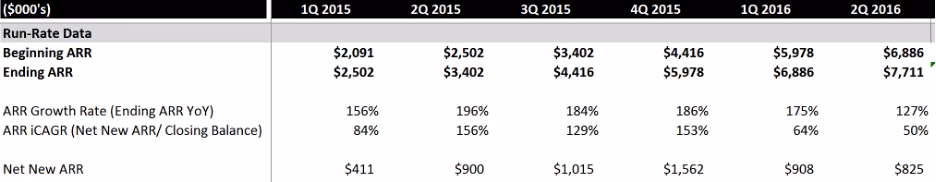
Turns out that in this case, the YoY growth rate had been masking the drop off in Net New ARR added in Q2 2016 vs. previous quarters. In comparison, the Scale iCAGR (now added) picked up this steep decline, which is reflected in the substantially lower 2016 Q2 iCAGR of 50% vs. the YoY metric of 127%. Maybe this is a sign of future growth being less robust or maybe it’s just a one off event: either way it needs to be run to ground.
What is your company’s iCAGR?
In sum, we hope this post represents the beginning of a longer conversation on what a growth rate can tell us about a business, how we should define it, and why it matters. The benefit to bringing rigor to growth rate calculations extends beyond venture capital: managers of SaaS businesses use growth rate calculations when thinking about business forecasting, hiring employees, and managing the growth/ profitability tradeoff. We believe this is an under-researched topic, and we want to drive more discussion within the startup community for how we describe real, tangible growth.
News from the Scale portfolio and firm