SaaS Metrics: A Primer on SaaS Sales Efficiency


The Four Vital Signs of SaaS is Scale’s framework for the four metrics that best measure the health of a SaaS software company. So far this year we’ve taken deep dives into Churn and Retention (start here) as well as Burn Rate (start here). Next up is Sales Efficiency.
Let’s start with an observation: a lot has been written about SaaS Sales Efficiency (SE). So much that there are different measurement techniques, special cases, even conflicting schools of thought. It can be distracting and even a little confusing — especially because the concept itself is straightforward and easy to wrap your head around. And it’s worth it, because Sales Efficiency is a powerful tool for measuring how your company performs at one critical core function: selling software.
What Is SaaS Sales Efficiency?
Sales Efficiency tells you how efficiently your company creates value. It does this by comparing new revenue for a given period to what was spent on Sales & Marketing in the same period. It gives you a single, difficult-to-argue-with data point:
Sales Efficiency is the amount of new revenue generated for every dollar invested in selling and promoting.
Here’s some context. In the Scale Studio dataset of 1,000+ growth-stage SaaS and cloud businesses, the long-term median Sales Efficiency hoovers around 0.7.* That means that a typical SaaS startup generates $0.70 in new ARR for every $1.00 it spends on Sales & Marketing. That is, “For every $1 this company spent on Sales & Marketing, you (Sales Leader) gave me $0.70 in sales.”
* To be precise, the 0.7 figure is the median Magic Number (MN) for the dataset. MN is a GAAP-based version of Net Sales Efficiency, which we’ll explain in more detail below.
Companies with highly efficient sales models and flawless go-to-market execution might see sales efficiency go above 1 but it’s rare and speaks to unique and attractive aspects of their go-to-market model. Show a room of investors a data point like that in your pitch deck and your inbox will be overflowing.
Note that we have been using the generic “sales” and “revenue” and “sales and marketing” on purpose to keep things simple. But at this point we can get more specific. Sales Efficiency is most often calculated using either Gross New ARR or Net New ARR for a given period (like a month or quarter). Your finance team is already tracking these numbers, so it doesn’t take extra work to feed it into the SE calculation. The denominator uses the entire “Sales & Marketing” line item from your P&L. (Generally, we prefer to exclude stock- based compensation (SBC) because it is a non-cash expense that gets included in GAAP financials.)
As we’ve said, there are endless exceptions and variations and schools of thought about the Sales Efficiency metric. But the bare bones, just-the-facts methods we share below provide a lot of insight for a lot less work, yielding metrics that anyone on your team can understand and make use of.
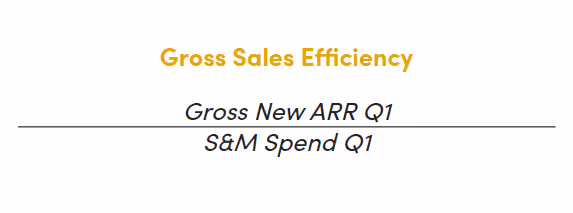
Gross Sales Efficiency: Focus on the Positives
Gross Sales Efficiency focuses on the positives: new ARR generated during the period with no adjustments for churn or downsell. The denominator is simply the total Sales & Marketing expense during the same period.
Because it uses unadjusted Gross New ARR, Gross SE gives you a clean look at how efficient your sales and GTM processes were during that period.
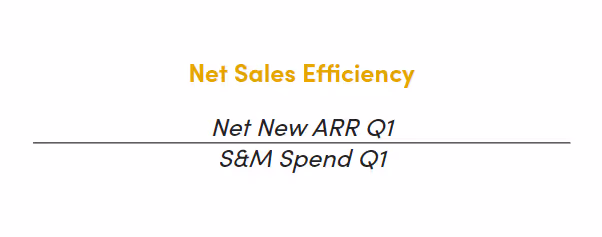
Net Sales Efficiency: Includes Wins and Losses
The numerator for Net Sales Efficiency is Net New ARR, which means we’re accounting for both new sales and lost business. The denominator is the same as with Gross SE, total Sales & Marketing spending for the period.
One of the strengths of Net SE is how much information is captured in a single data point. Even early on in a company’s growth path, there are an awful lot of people and processes involved in selling, marketing, and retaining customers. Net SE gives everyone in your company a target that’s easy to understand and explain.
Magic Number: Benchmark across Companies
There is one important limitation in the Gross and Net Sales Efficiency calculations we just looked at. There’s often a fair amount of variation from company to company on how ARR is recognized, which means that you can’t easily formulate a comparison with other companies.
Scale developed the “Magic Number” (MN) as a workaround, replacing ARR with GAAP revenue. Because GAAP standardizes how and when sales are recognized, the Magic Number allows comparison between companies and, even better, benchmarking of one company against other comparable companies.
Here’s how that looks:
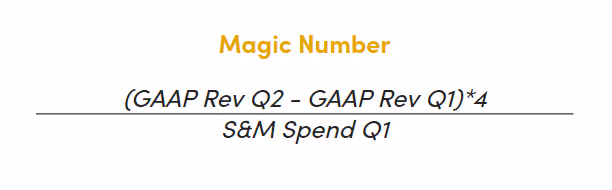
MN replaces Net New ARR in the numerator with the difference in GAAP revenue between the most recent periods. It then annualizes that figure (*4) to bring it closer to an ARR value that is by definition an annual figure. With those adjustments, Magic Number becomes a great stand-in for Net Sales Efficiency that also allows you to compare apples-to-apples the efficiency of two or more different companies.
The Magic Number is the focus of the next three articles in this series. So we’ll leave it at that for now.
Sales Efficiency and the Go-to-Market Model
Sales Efficiency behaves differently from, say, sales growth or churn rate as a company develops. Growth rates decline over time as a company scales. Likewise, burn rates tend to improve over time as companies mature and approach cash flow breakeven.
Sales Efficiency, however, tends to be pretty sticky. It often persists over time for a given company, especially after $10M in sales. This is important, because it makes developing an efficient go-to-market model critically important early on. That model — and its inherent efficiency — is most likely going to be with you for some time.
There are exceptions, of course. Some companies do in fact rewire their sales and go-to-market motions. But don’t count on it. Instead, give everything you’ve got to developing an efficient sales engine early in the game. It will pay dividends down the line.
News from the Scale portfolio and firm