Burn Rate: A Founders Refresher on SaaS P&L


Building a SaaS product and founding a SaaS company do not require mastery of the Profit & Loss (P&L) statement. Leading a successful venture-backed SaaS startup does.
For subscription software businesses, Annual Recurring Revenue (ARR) is the leading indicator for growth — but building a company to go all the way to IPO also requires fluency in Generally Accepted Accounting Principles (GAAP). GAAP accounting is the basis for the financial data that public companies release every quarter.
The following is a founder-focused overview of the GAAP P&L and the special requirements it has for subscription-based software companies. This article is the introduction to a new Scale blog series focused on measuring and improving cash burn rates. As we did with our Churn series, we’ll start with the fundamentals then go very deep into how to use this information to run a data-driven company.
SaaS Profit & Loss Overview
The Profit & Loss statement is one of three financial statements that a typical corporation generates on a periodic basis (monthly, quarterly, annually). It is more formally known as the Income Statement in the trio of core financial statements that also includes the Balance Sheet (the table of assets, liabilities, and shareholder equity) and the Statement of Cash Flows (a cash-oriented view of the business).
The basic SaaS P&L has a handful of key categories:
Revenue. Sales for the period, often broken into two or more sub-categories that track different products and/or services. Note that this is revenue as defined by GAAP and not ARR/MRR.
Cost of Revenue (COR). The costs of serving a company’s SaaS product(s) and servicing its customers, primarily employee and technology infrastructure costs. Also called Cost of Sales (COS) or Cost of Goods Sold (COGS).
Gross Profit/(Loss). Revenue minus Cost of Revenue. Gross Margin % is calculated using this number.
Operating Expenses. Costs related to ongoing operations, including three main main sub-categories:
- Research & Development (product development)
- Sales & Marketing
- General & Administrative (e.g., HR, IT, Finance, real estate, and other administrative costs not otherwise attributed to R&D/S&M)
Operating Profit/(Loss). Gross Profit minus Operating Expenses.
Other Income/(Expense). Non-operating expenses like interest income or expense, income taxes, expenses associated with discontinued operations, etc.
Net Profit/(Loss). Operating Profit (Loss) minus Other Costs.
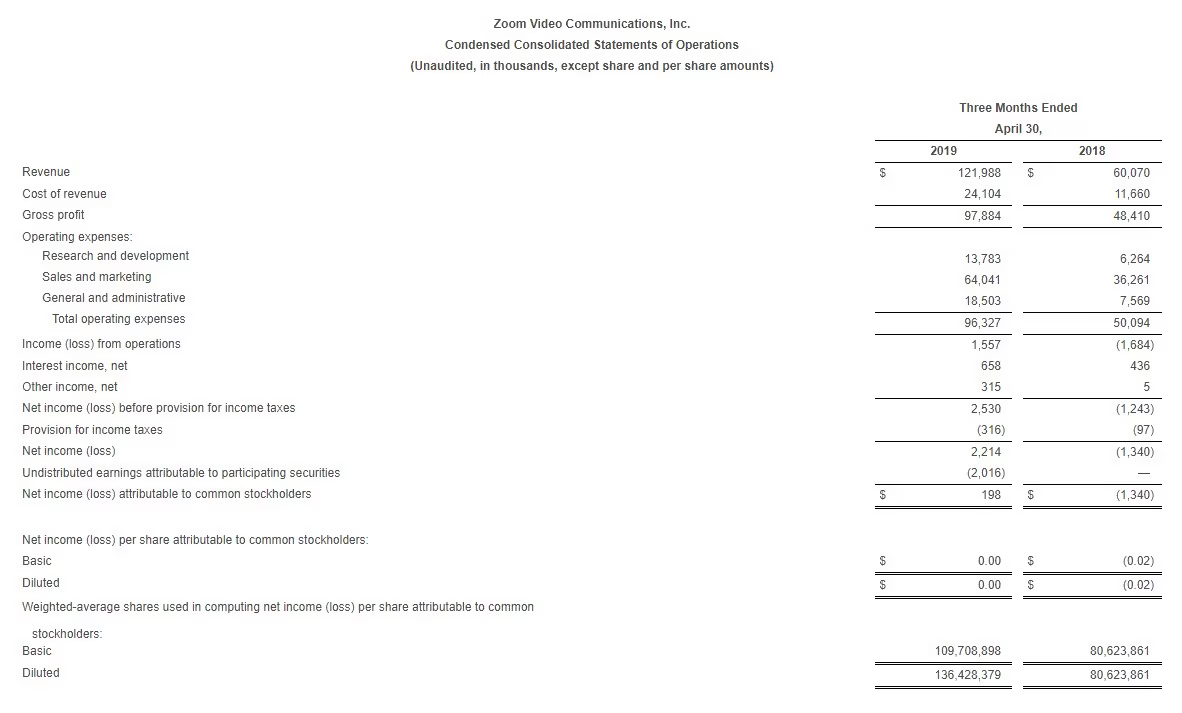
The basic reporting structure doesn’t change much from startup to public company. As you can see in Zoom’s first quarter 2020 income statement:
Revenue vs. ARR and MRR
You’ll notice that ARR and MRR are nowhere to be found in the P&L. Though everywhere in SaaSland, ARR bookings are an industry metric and not officially recognized under GAAP. GAAP is revenue focused, and requires that most SaaS companies recognize annual contracts in monthly chunks (“ratably over time”). ARR / MRR bookings are absolutely critical measures of growth and the basis for the four key operating metrics. But when it comes to P&L accounting, GAAP is the focus for its utility showing you line-by-line how you are performing as a business.
Also keep in mind that there is a lot of variation in accounting practices from company to company, even among traditional, annual contract enterprise SaaS and especially for SaaS pricing models with service offerings or usage-based / metered pricing. GAAP provides guidance on how to broadly account for and recognize revenue.
What’s most important for a founder to know is that your finance team should account for and report each category of income and expense in accordance with prescribed guidelines under GAAP. The big picture advice here is to emphasize good bookkeeping practices from the beginning then remain consistent over time so your performance metrics have as much historical perspective as possible.
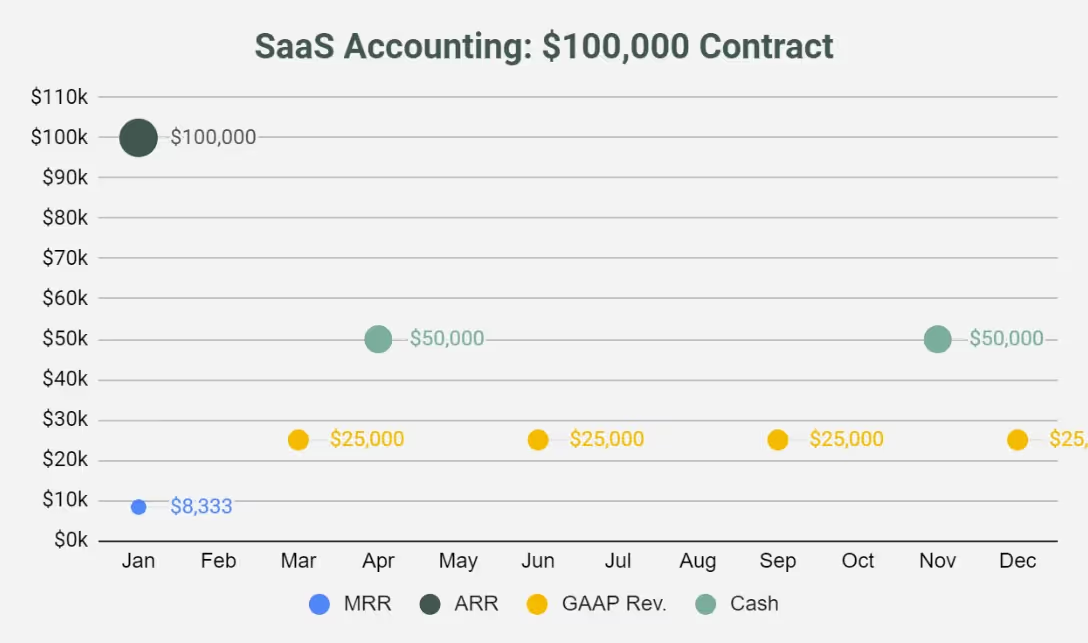
The following chart shows how a single $100,000 annual SaaS contract could be recognized in different financial contexts: MRR, ARR, GAAP revenue recognition, and cash. We’ve assumed that the customer makes bi-annual cash payments of $50,000, and shown GAAP revenue recognition quarterly. ARR and MRR are shown as one-time additions to the company’s ARR/MRR bookings pool.
Gross Margins
You’ll often hear that a well-run SaaS company should have 80%+ Gross Margins. That’s a fine rule of thumb, but there’s much more to the story.
First, the expenses that go into that 20% of revenues can vary widely. Think of your Cost of Revenue as what you spend to keep your software running and your customers happy. That will generally includes a few big categories:
- Technology costs like cloud hosting, servers, and related infrastructure spending.
- People costs like the salary/wages, benefits, and payroll taxes of employees that maintain your software. That does not include product development costs, which go into R&D operating expenses (as described below).
- Other technology and people costs like the cost to support your product, including technical customer support, onboarding costs, and retention-focused customer success.
Note that customer success team members focused on renewals, up-sell, and cross-sell are considered Sales & Marketing expense (in OpEx, not COR). In practice, most SaaS Customer Success programs have CSMs devoting some portion of their time to renewals and upsells; even a small portion of time spent on these activities means that those expenses should be allocated to Sales & Marking in OpEx.
Not every SaaS company can or should hit the “80% rule.” Consider the costs required to maintain a SaaS infrastructure product that promises Five-Nines uptime, has a global customer base, and always-on functionality versus an SMB product where uptime isn’t a critical factor and usage is periodic throughout a week. Or the front-loaded investment of the human-in-the-loop AI business model. Both have very different cost structures from traditional SaaS. Venture investors will take those differences into account and factor in the many other factors that matter — market size, technology advantage, company leadership, and so forth.
Often what is most important with Gross Margin is the trend: Can your company demonstrate that it has sufficient operational leverage to improve margins over time? If GM% is low early on, can you articulate a path to higher margins as you scale?
Operating Expenses
Expenses that do not fall into the Cost of Revenue bucket are considered operating expenses (OpEx). Here the three major categories are:
Sales & Marketing. All of the costs incurred in selling and promoting your product. For a typical early-stage SaaS company, S&M expense accounts for around half of total OpEx. These expenses include:
- Payroll for sales team (salary+commissions+benefits+payroll taxes)
- Payroll for marketing team (salary+benefits+payroll taxes)
- Advertising and conferences (e.g., digital offline ads; events that team members attend to promote your product/company)
- Software and tools used by sales and marketing teams
- Cloud costs associated with trial acquisition, as it’s generally a lead generation platform and, thus, marketing.
- Outside vendors who support S&M, including consultants and contractors
Research & Development. Product development costs including dev teams, the software and tools they use, and other direct costs for building your SaaS product. “Product development” is what we’re talking about here, distinct from the product costs in COR tied to running and maintaining the software.
- Developers and product teams, including salary + benefits + payroll tax per employee
- Software and tools used by these teams in their work
General & Administrative. Overhead not accounted for in the other categories. Often a catch-all for all day-to-day expenses related to running the business like:
- Rent on office space, utilities payments, communications services and usage
- Executive salaries+benefits+taxes
- IT/Finance/Accounting/HR teams and other support staff salaries+wages+benefits+payroll taxes
There’s an important best practice related to how expenses are attributed to the different categories: be scrupulous about fully allocating departmental expenses to the department–and not to a G&A catchall bucket. This means that your S&M and R&D lines should reflect the department’s portion of costs like legal, rent, and recruiting. In some ways, it’s like treating the two keep departments as operating entities, setting up your P&L to accurately reflect what it costs to run them. Doing so will improve your internal tracking of KPIs like, for example, marketing ROI. And of course allow you to benchmark those functions against other similar companies.
Other Costs
Expenses that don’t fall into any of the above categories are grouped into an Other Costs bucket that sits between Operating Profit (Loss) and Net Profit (Loss). These include items like Interest Expense (payments on debt and lines of credit), interest income (earned on idle funds) and income taxes. Non-cash charges, or expenses required by accounting rules that do not correspond to a cash outlay such as depreciation expense on computer equipment and software (depreciation is the accounting concept that assets decline in value over time as they are used) may also be reported in Other Costs, or may be considered an Operating Expense.
This lower section of the P&L statement isn’t generally a focus of early stage investors. The key signals of a company’s performance and potential lie higher up at the Sales, Gross Margin, and OpEx lines. Other Costs become more important as a company approaches the $100M ARR threshold where an IPO becomes possible. At that point, Net Profit comes into focus, often in the form of measuring a company’s Rule of 40 metric.
Performance Benchmarking with Common Size
So far we’ve looked at the P&L on a dollar basis: each line item displaying the actual dollars taken in as sales and spent as expenses. But there is another view of the P&L that provides a lot of value: Common Size. With Common Size, you convert each expense line into a percentage of revenue. It looks like this:
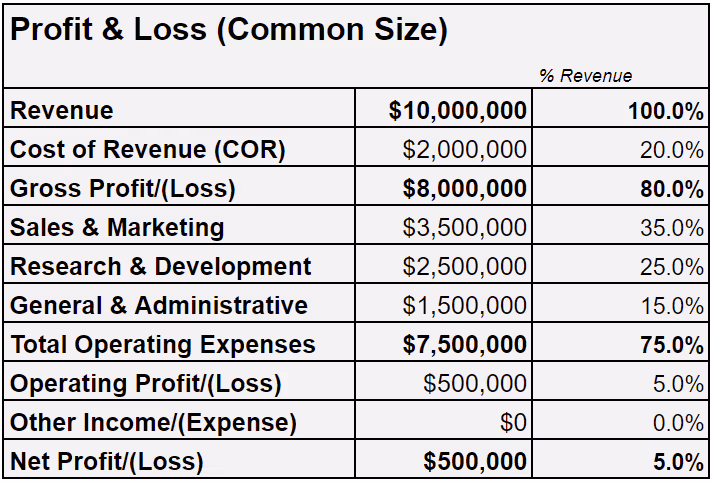
From a metrics perspective, investors often use common size to normalize the cost structures of two or more companies, calculating OpEx line items as a percentage of total Operative Expenses. So, R&D as % of Total OpEx or S&M as a % of Total OpEx.
As we dive deeper into burn rate reduction, Operating Expenses is an area filled with opportunities to reduce or eliminate spending — or, more formally, to bring OpEx to a level better aligned with growth rates and return on capital.
Operational Efficiency Isn’t a P&L Line Item…But It Matters
How streamlined is your business? One key performance measure that P&L alone can’t tell you about is the efficiency of your teams and operating processes.
Take this example: a company spends $1M on S&M during a quarter and generates $2.5M in revenue. What happens if it doubles S&M spending to $2M — should the company expect to generate $5M in revenue? It’s rarely that simple. There are a lot of operating processes between S&M spend and new sales. Operational efficiency is an x-factor in a company’s money out versus money in.
That’s where SaaS metrics come into play. By thoughtfully tracking and analyzing key operating metrics over time, you can learn about the sensitivities between spending and new sales. We’ll have a lot more to say about that in the next articles in this series.
News from the Scale portfolio and firm