From $0 to $1M: Compounding Growth


Your startup’s growth rate is more than just a number. Or a feather in your cap. Your growth encapsulates a bunch of different things about your company, your people, and your product. Think of it this way, it’s highly unlikely you will grow quickly year after year if:
- You have the wrong people in key positions
- Your product doesn’t provide real, lasting value
- Your operations are a mess
Turn that around, and high growth becomes a powerful signal of strength: a strong team, making smart decisions, selling into a large market hungry for your solution.
So what counts as a “great” growth rate? There’s no single universal answer. But there is data. During the critical growth window of $0 to $1 million in ARR, here’s what good/better/best growth rates look like, using Forward ARR growth benchmarks from 300+ companies in the Scale Studio dataset:
90% percentile: 1420%
75% percentile: 678%
50% percentile: 365%
This shows that the top 10% of companies in the dataset (the “best”) will grow on average 1420% during the $0 to $1M period. While the median (50%) company will grow at 365%.
Remember up top where we said growth isn’t some vanity metric. Watch what happens when we compare three hypothetical companies with the good/better/best growth rates. We’re assuming for simplicity that each company ended 2020 with $500K in ARR. We then calculate out how that revenue grows at the 90th, 75th, and 50th growth rates. There’s some complexity behind how this is calculated, but we’ll save that for another time…
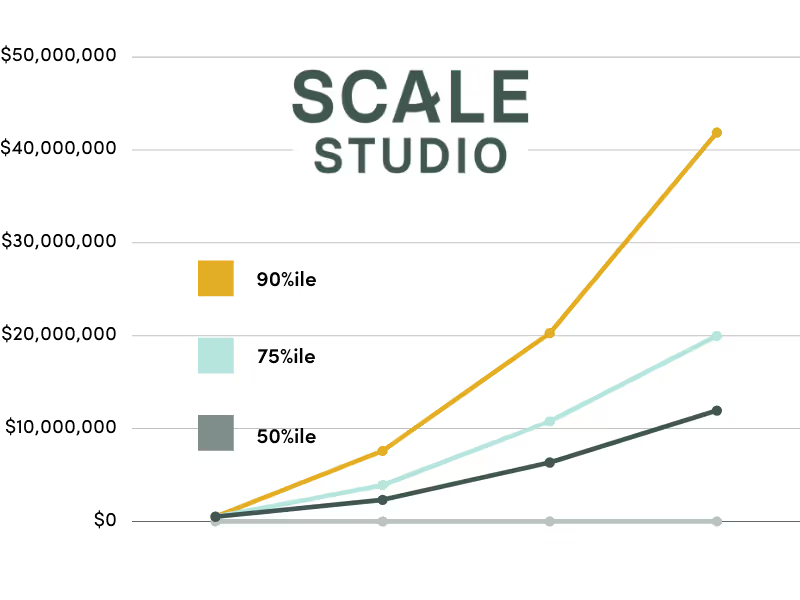
…because the outcome needs no explanation. A 90th percentile growth rate is going to open a lot of doors: investors, customers, recruits.
The chart is also a good look at what constitutes hyper-growth right now today in enterprise SaaS. How’s your company doing? Scale Studio has Reference Benchmarks covering growth rates, retention/churn, sales efficiency, and cash burn at specific revenue levels. It’s a quick and easy way to understand your company’s performance using real-world data from companies like yours.
Founders’ resources on growth rates:
News from the Scale portfolio and firm