Think larger customers are your only path to success? Think again

In Silicon Valley, we tend to focus heavily on viral user growth and valuations to determine how healthy a startup is. While growth and profitability are clearly important, there are plenty of other ways to gauge startup success that go overlooked, but are just as significant. Average Selling Price (ASP) is one, especially for SaaS companies.
Not all statistics are born equal — some are more telling than others. For SaaS companies, tracking ASP per customer is akin to knowing the value of your real estate’s square footage. ASP is the baseline that allows for easy comparison between any two companies via a simple calculation (revenue divided by customer count). Two factors most commonly determine ASP for a company: 1) the target customer size, and 2) the ability to extract value out of that customer.
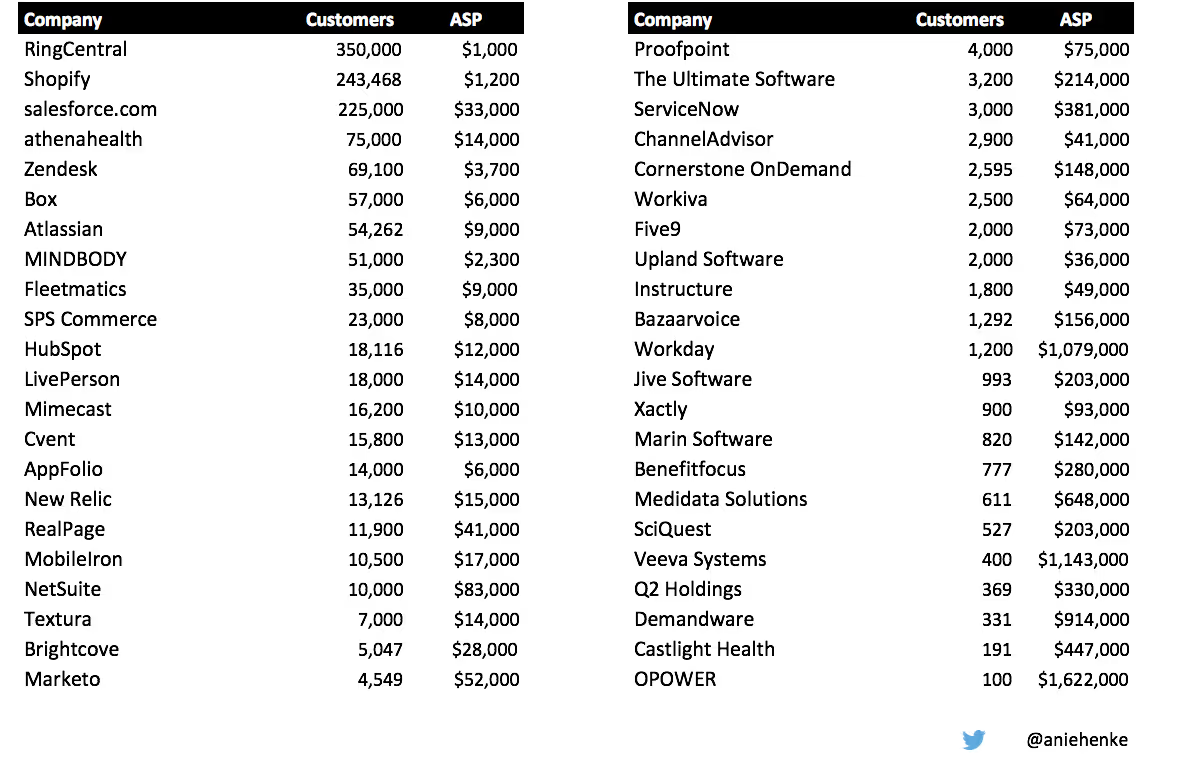
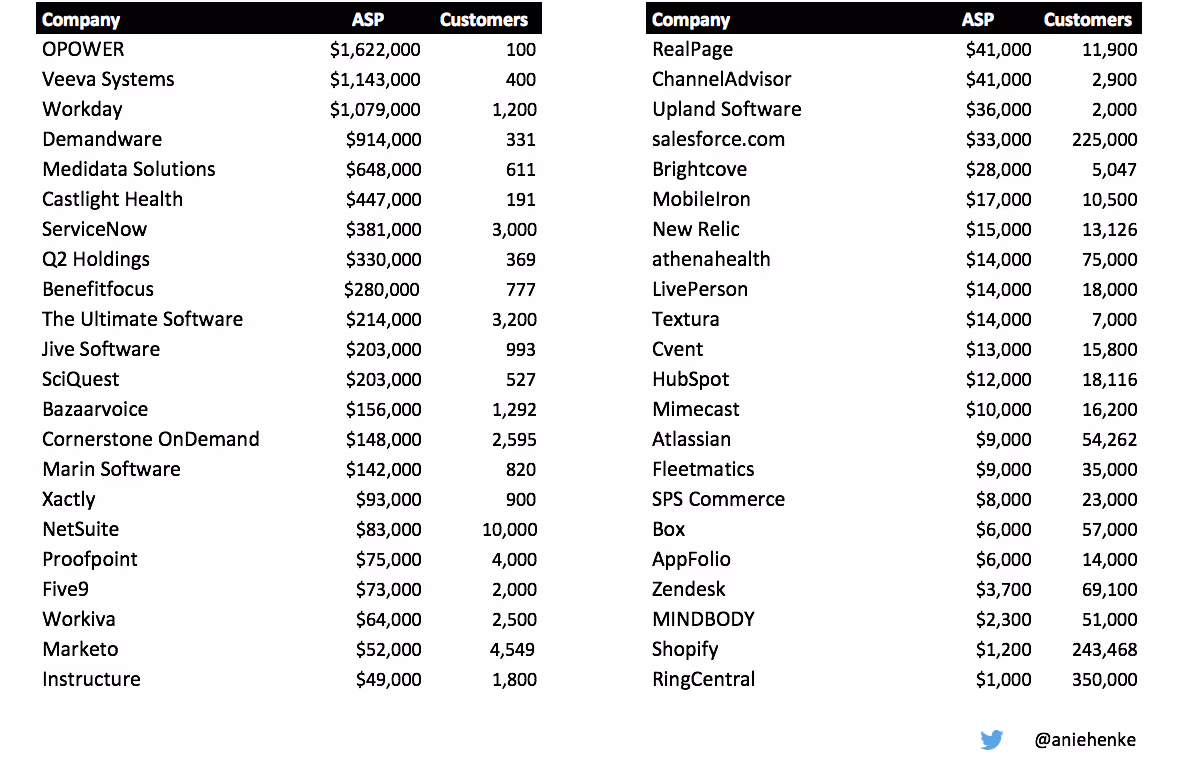
Despite what you might think, companies with a larger ASP don’t always generate the most revenue. To explore this idea further, we analyzed the ASP and customer count for 44 Public SaaS companies from the ScaleVP SaaS Index.
We looked into the statistical correlations between ASP and success indicators like higher revenue multiples or greater enterprise value. Interestingly, there is no correlation between ASP and revenue multiple, ASP and customer count, ASP and enterprise value, or ASP and annual recurring revenue (ARR). However, the data did uncover that ASP size does correlate with other measures of success. Here are the biggest takeaways from our research:
1) A small ASP can be highly valued
Many investors are reluctant to invest in SaaS companies with a small ASP. Some argue that if the ASP is too low, reasonable levels of customer acquisition spend cannot be justified, nor can enough customers be accumulated to build a large business. It’s unclear how this myth came to be, but there is no correlation between small ASP and lower revenue multiples or a low enterprise value.
Digging into the data actually highlights a different conclusion. Several companies with lower ASP, such as Shopify and Hubspot, have some of the highest revenue multiples. AthenaHealth has an ASP of only $14K and total revenue of over $900M at an enterprise value of $5.6B. That makes AthenaHealth the fourth largest SaaS company by revenue and enterprise value, even though it has a low ASP.
2) A large ASP suggests vertical software
Of the six largest ASPs in the index, Workday is the only broadly horizontal SaaS solution. The five others — Opower, Veeva, Medidata, Demandware, and Castlight Health — all sell into vertical industries. Discovering that largest ASPs are usually vertical industry solutions was initially a surprise, but after further analysis makes a lot of sense. Verticals industries are bound to have a smaller number of customers, but the solution delivered is vertically-specific. This allows the company to capture more pricing power and sell more industry specific features. The customer likely also has less alternative options. As an investor a key criteria I now look for in vertical software is a large ASP.
3) You do not need a lot of customers to go public
Opower is a fascinating outlier in the group with only 100 (yes 100!) customers and over $150M in revenue. That means the average Opower customer pays an impressive $1.6M. Opower is not the only example of a public company with a very small customer count. Castlight, Veeva, and Demandware all have less than 400 customers, yet are public and trading at strong multiples. A big business can be built on a small number of customers if the solution is very important to that customer and they can afford to spend a lot for each installation.
4) Recent IPOs have had small ASPs
The class of 2015 IPOs all have ASPs below $10K with the exception of Xactly. Similarly, the class of 2014 includes a number of companies with small ASPs such as Zendesk, Hubspot, and New Relic, all of which have an ASP below $15K. This trend suggests that it is increasingly becoming more popular to sell SaaS to a large number of customers at a small ASP. New selling techniques make it more efficient to capture small ASPs. It is also likely that as SaaS is maturing, the opportunities for new entrants are often in capturing the small- and mid-market customers that the incumbents have not addressed.
5) It’s not the size of your customer that makes the difference
An entrepreneur can manage change in an ASP over years, but big movements are hard from from one quarter to the next. The law of averages is too hard to quickly overcome. Moving upmarket is one common pattern that many companies have pursued over time. Since ASP is hard to change in the short-term it is easy to discredit as a key operating metric.
However, that would be short-sighted and dismissive of the learnings from this data set. Recognize that few broad, horizontal SaaS solutions have reached public status at an ASP north of one million. Likewise, most vertical SaaS solutions that have gone public have very large ASPs. Years ago a small ASP and large customer count was infrequent at the scale required to have a public offering. That has changed as we are seeing new entrants quickly grow with this strategy.
ASP should be used as a benchmarking tool to understand how other similar businesses reached success. Analyze the sales strategy, marketing approach, product investment, and growth of comparable SaaS businesses. It won’t answer all questions, but it can be a compass that points you in the right direction.
News from the Scale portfolio and firm