Annual Planning for Early-Stage Startups (Tools and Templates)


Go directly to Scale’s Annual Planning Tool. This blog explains the 4 data points required to generate an annual plan draft. Additional resources for early-stage founders are listed below as well.
It’s been said that a goal without a plan is a wish. This is an article about ensuring that your annual plan goals are grounded in data, so your targets are more than just wishful thinking.
Let’s start with a seemingly straightforward question: How fast are you going to grow next year? Before the year ends, you need that answer to make decisions, allocate resources, and provide your teams with the foundation for their own goal setting next year. One thing you don’t want to do is take a top-down approach to picking a growth rate, as in “Last year we grew 100% so next year let’s shoot for 100% again!”. This is the wrong way to get started. You need to build an answer, not put your finger to the wind.
Every company has its own motivations when it comes to growth and growth rates. Keep these front and center during planning, things like whether your strategy is to be a venture-backed business or bootstrap using savvy cash management. Each requires different approaches to how you grow.
The good news is that it doesn’t take much data to build a reliable first draft of an annual plan. This is especially helpful for early-stage companies that don’t have a ton of historical finance data or trend lines. You can simply use a handful of (known) data points and fill in the gaps with real-world benchmark data.

Start with the Tools page on Scale Studio. The Annual Planning Tool can serve as the basis for the first draft of an annual plan. It takes just four data points to generate a set of quarterly and full-year forecasts covering your entire P&L, operating expenses included.
Let’s walk through how to use it and how it works.
Walkthrough of the Annual Planning Tool
The inputs are straightforward:
- Current Year Ending ARR. This is your projected end of year recurring revenue level expressed in ARR (not GAAP or MRR).
- Forward Growth Percentile (Top Decile / Top Quartile / Median). This is where you tell the tool about your current growth rate aspirations in the form of Top Decile, Top Quartile, or Median performance. A quick way to know the answer is to run the Scale Studio “Full Report” then input your Growth performance tier.
- Gross Profit Margin. Use your most recent quarter’s Gross Margin percentage, though the tool can be used to look at the financial impact of margin changes (up or down). The default 70% is the median gross margin across the entire Scale Studio data set. Check out our primer on SaaS P&L.
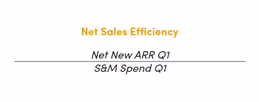
- Net Sales Efficiency. Input your Net Sales Efficiency; here again the default is a typical level for a SaaS company. This is a key metric that we’ve written about extensively (start with this sales efficiency primer). For reference, the calculation looks like:
Once the Inputs are in place, the Outputs data box highlights several key projections. Here’s what those are and how they’re calculated.
- Current Year Ending Benchmark Band. Scale Studio benchmarks are calculated using companies at your same stage of growth. We’ve found that there is a lot of similarity among companies during specific revenue levels, like for instance $0 to $1M or $5M to $10M. This field shows the band we used in our calculations.
- Y/Y Forward Ending ARR Growth. This is the projected growth rate of ((Ending ARR FYE22 / Ending ARR FY21)-1). Or more simply, your ARR growth rate for 2022.
- Next Year NNARR ($). Circle this in red then highlight it. Net New ARR tells you how much new ARR you need to add during the full year to achieve that target growth rate. It’s the reality check on your projections. A growth rate by itself often looks doable. NNARR tells you exactly what you’ll need to generate to make it happen.
- Next Year Ending ARR. This is your ARR at the end of next year. We’ll say more below about the role of OpEx projections in arriving at this dollar value.
Using Benchmarks for Reliable OpEx Projections
The Annual Planning Tool’s magic is in how it calculates projections for Operating Expenses: Sales & Marketing (S&M), Research & Development (R&D), and General & Administrative (G&A).
The OpEx line items are calculated by comparing your company’s revenue band for the period (defined above) against a benchmark data set consisting of actual performance (spending) as each passed through that revenue band.
You really see the advantage of “building” a plan this way. These OpEx figures aren’t arbitrary or derivative placeholders. They show in aggregate how companies like yours allocate expenditure to each major functional area. They provide reliable guidelines for spending targets and, even better, they fit perfectly into the larger “story” of the plan: NNARR targets.
The tool assumes your NNARR is steady quarter to quarter, but it can be adjusted to account for issues like seasonality or an expected 3Q/4Q growth surge. Again a reminder to use the Tool as a starting point that you iterate on.
As for presenting your plan, we’ve put together a set of Board deck templates set up to add real-world context to how you present your company’s performance and projections. Check it out, as well as these other planning resources:
Annual Planning Resources
- Scale Studio Tools has calculators, tear sheets, and downloadable Board deck templates.
- Scale Acceleration Factor is a useful metric for understanding NNARR growth rates.
- Annual Planning for SaaS Companies, a Board member’s perspective on planning.
- Admitting Ignorance: Planning in the Time of COVID, a look at planning processes during unusual circumstances.
- 2021 Whisper Numbers: Startups Plan for Significant Enterprise Software Re-Acceleration, this blog from 2020 remains useful for its context on how big-picture macro factors impact the individual company’s plans.
- Scaling: Seed to Series A. Resources for founders leading early-stage startups.
- SaaS Metrics: Vital Signs. Our content on the SaaS “Vital Signs” of growth, efficiency, churn, and burn.
News from the Scale portfolio and firm