SaaS Metrics: Getting More Signal from the Churn Metric


The first article in our deep dive into Customer Retention series focused on what the Churn metric does really well and where its limitations lie. We recommended looking at Gross Churn rate as a diagnostic tool for monitoring the ongoing health of your customer base. But, like vital signs in the ER, don’t rely on it to tell you everything about the cause of the problem.
This article looks at how to get the even more “signal” from the Churn metric. We’ll return to our hypothetical early-stage SaaS company, which has just posted a big quarter. By looking at the impact of revenue upside on Churn rate, we can launch into specific ways to smooth out the calculation and make it more reflective of the situation on the ground.
After all, the true value of tracking any given metric is how well it helps founders and teams make better decisions.
Adjusting Churn Rate for Big Quarters
You don’t often hear about a SaaS startup having too big a quarter. But it’s good to remember that quarters with big jumps in ARR will impact your Churn rate by inflating the denominator. It’s obvious when you think of it, but in my experience not everyone remembers to think about it.
Why is this an issue? Often I see companies working with Churn data where the reporting period doesn’t match up to the contract period. If the contracts are quarterly and they’re measuring Churn quarterly, then this isn’t an issue. But if the contracts are longer – say, a year – then the new ARR being added to the denominator can’t churn for a year out. Refer back to the first article in the series for the discussion on aligning the Churn rate calculation to contract length.
A “big quarter” can mean a big jump in Beginning ARR balance at the start of the next quarter. This jump increases the Churn rate denominator (Beginning ARR) so that, all things being equal, the Churn rate declines. A “big quarter” can also come from seasonality. A tax filing SaaS product, for example, might see a rush of new subscribers every 3Q as tax season kicks off. Software purchased by department heads who want to drain their discretionary budgets at year end can create a spike in 4Q sales.
There’s another version of the “big quarter” problem that we see a lot in early-stage companies. There’s a window of time after product-market fit — when both Product and Sales have hit their strides — but before nascent Customer Success teams have fully smoothed out their own processes. Companies see a lot of new customers sign up…then far too many leave soon after.
Back to our hypothetical SaaS startup for an illustration of how these variations on a “big quarter” impact Churn rate:
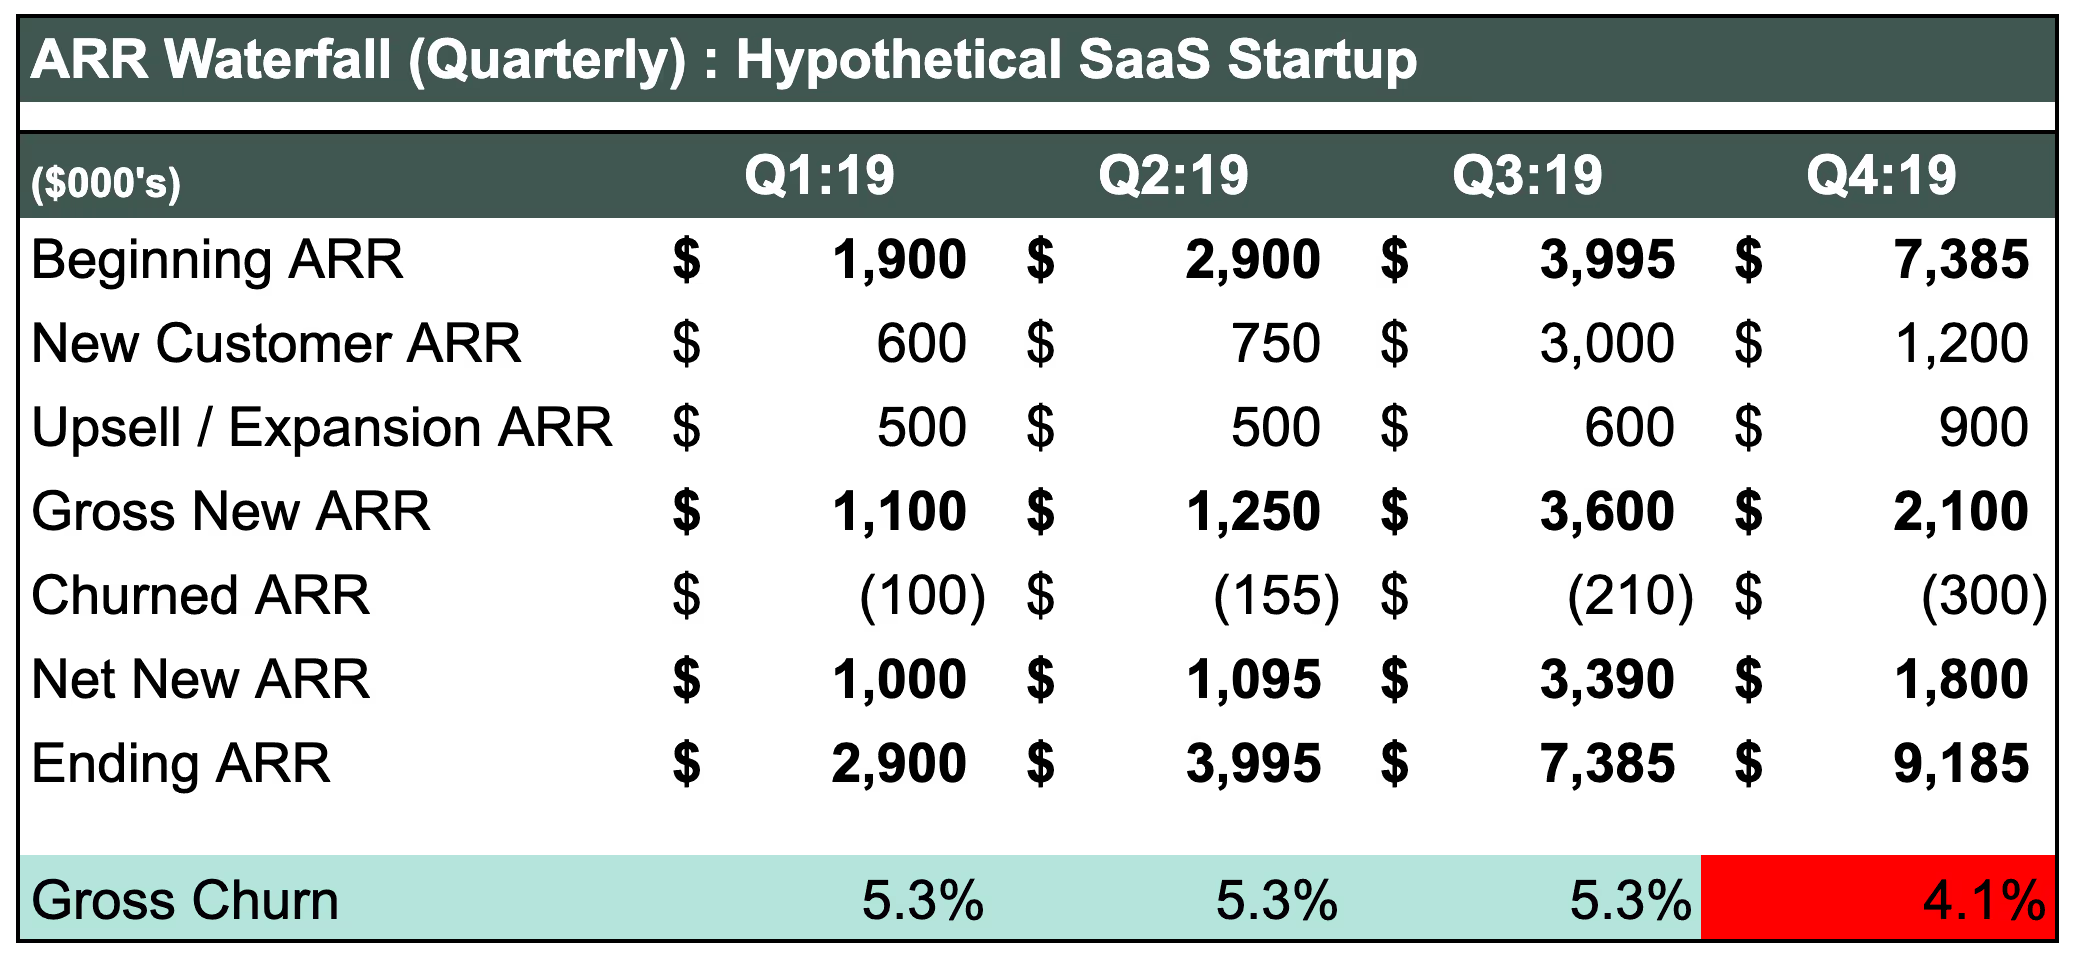
The quarterly view shows the strong 3Q with $3.4M in Net New ARR, bringing the 4Q Beginning ARR to $7.4M. At the same time, the Gross Churn rate improves from 5.3% to 4.1%. Things are really looking up!
The wrinkle here is this. The company’s 4Q Churned ARR could go as high as $(390) and still show a Churn rate in line with the first three quarters (5.3%). It would be easy to feel good about it. But that’s why you don’t rely on Churn alone to understand retention trends. We’ll leave this alone for now, but dive deeper into the solution when we look at cohort analysis in the next article in this series.
The takeaway here: big changes in ARR balance have big impacts on Churn rate. All things being equal, a jump in ARR means a better Churn rate. But that may or may not actually be the situation on the ground.
Fortunately, there are two easy adjustments that can provide added precision in the Churn rate: Fixed-Based Churn rate and Annualized Churn.
Fixed-Base Churn Rate
Fixed-based Churn involves anchoring on a specific ARR balance at a specific point in time. It’s a little counterintuitive: you get more precision by making fewer adjustments. The key is to look at the resulting periodic Churn rates cumulatively.
Here’s an example that anchors on the Opening ARR balance at the start of the year and measures Churn rate quarterly. Each period’s Churn correctly reflects the portion of the fixed Opening balance that churned. So by year end, the sum of all of the periods equals the annual amount of customer churn.
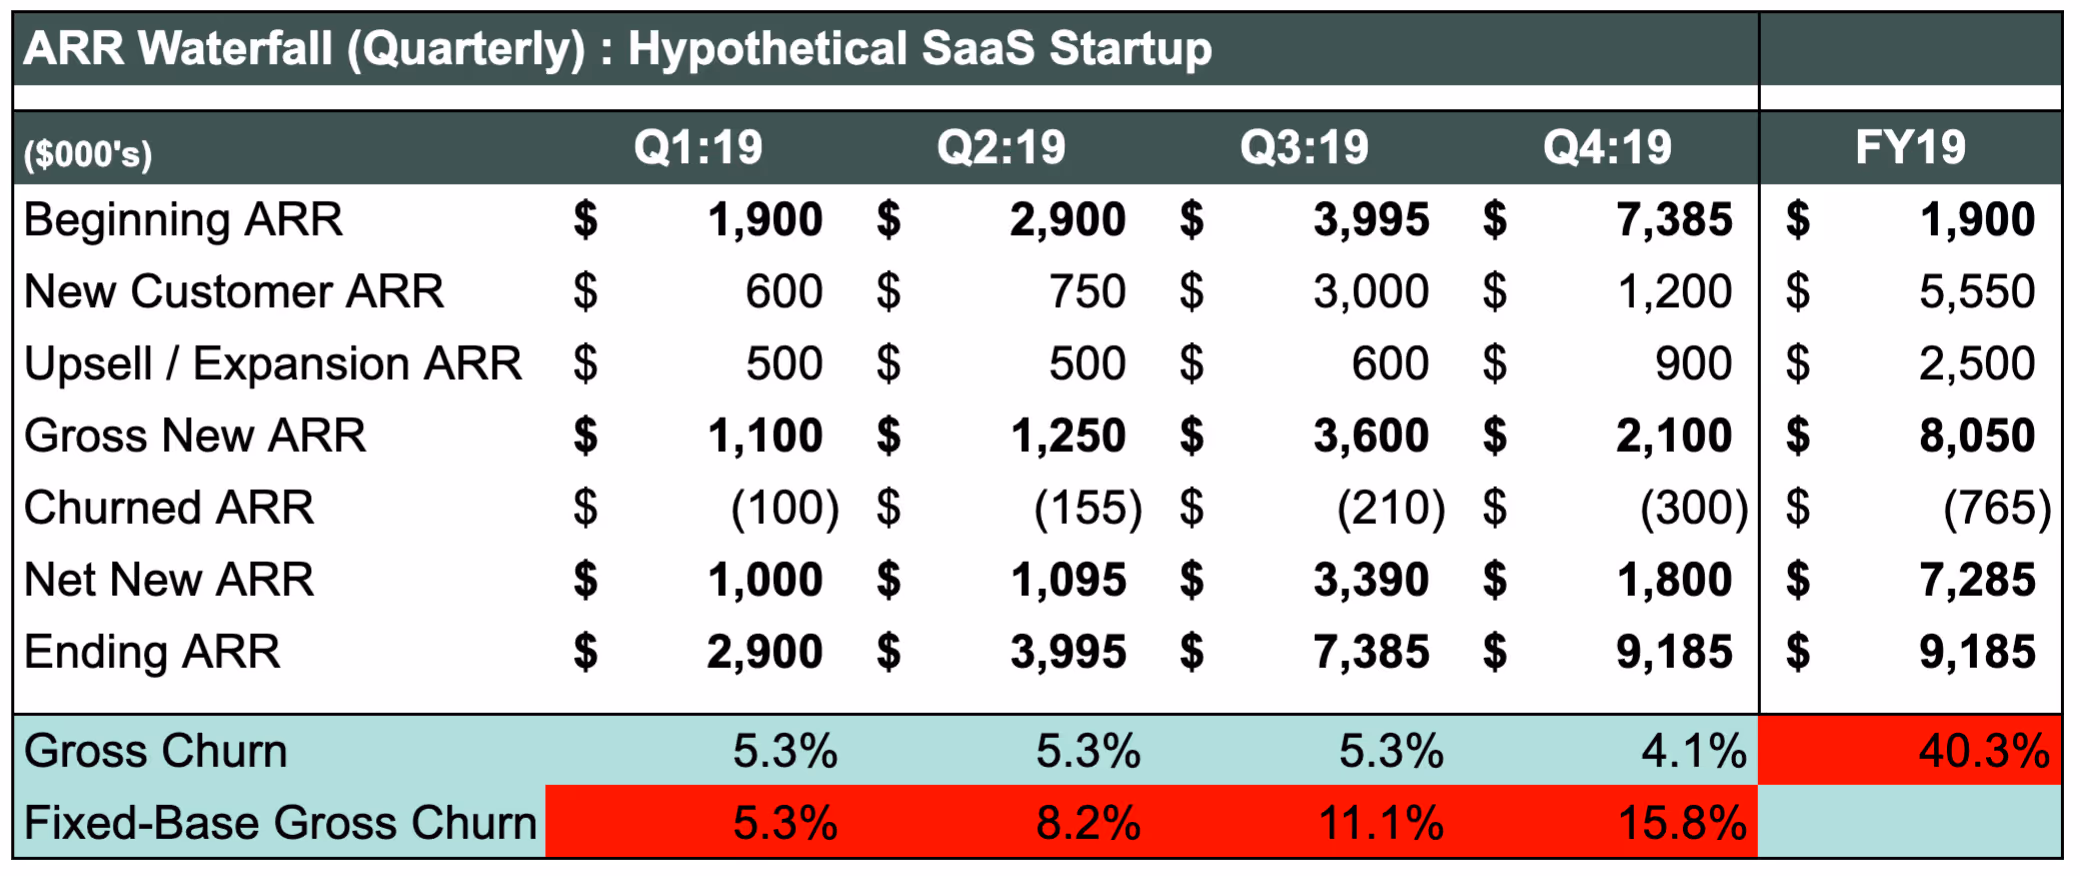
This example uses a quarterly Churn rate but you can use the same approach to anchor on the Opening balance for a monthly calculation. Just reset the anchor point as you move into a new quarter and use that same anchor as the denominator for each of the quarter’s three monthly Churn rate calculations.
Annualizing Single-Period Churn
You can easily create a projection of how the churn situation today will turn out if it continues for a full year by annualizing a single period’s Churn rate.
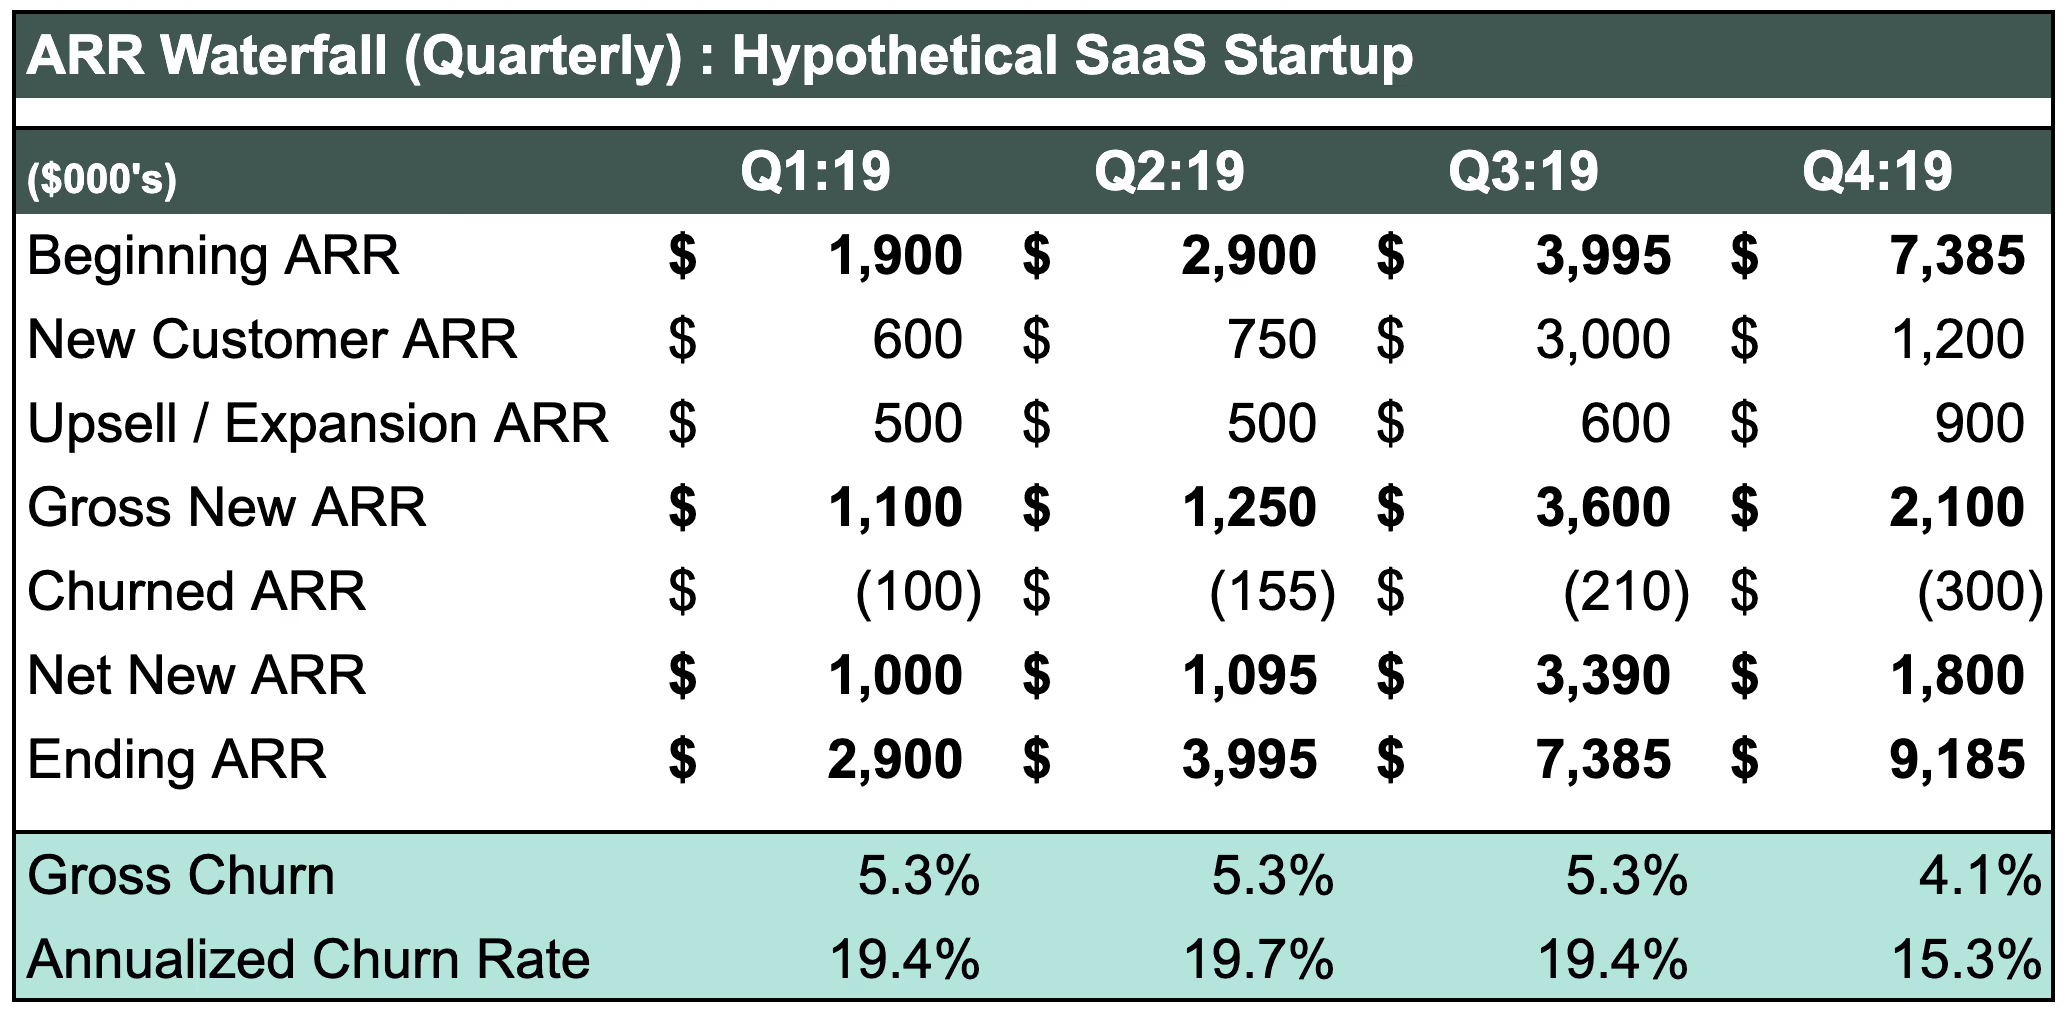
The easiest way to annualize a single period’s Churn rate is to multiply it by the number of periods in the year. So for a monthly Churn rate, multiply by 12. For quarterly, multiply by 4. The advantage here is this is a really easy calculation to make; the disadvantage is that you’ll tend to overstate your Churn.
A slightly more involved approach works better: geometric compounding. The formulas here look like this:
For annualizing quarterly churn:
1-((1-Churn.Quarterly)^4)
For annualizing monthly churn:
1-((1-Churn.Monthly)^12)
Here is how that looks:
Next Up: Cohort-Based Customer Retention
Tracking Churn rate — or any metric for that matter — isn’t an academic exercise. The goal should always be to give your teams reliable information that helps them make better decisions. You’re on the right track when your Customer Success and Marketing leads are working from the same data, speaking the same language, and working towards the same targets.
In the final article in the Churn and Retention series, we’ll look at what to do when a worsening Churn rate indicates that you have a problem retaining customers. We’ll introduce cohort-based renewal as a key tool in a Root Cause Analysis that answers the “why” behind a customer retention problem.
Continue with part three of the series.
News from the Scale portfolio and firm